

London Wider Waste Strategy - London - Greater London Authority
London Wider Waste Strategy - London - Greater London Authority
London Wider Waste Strategy - London - Greater London Authority

You also want an ePaper? Increase the reach of your titles
YUMPU automatically turns print PDFs into web optimized ePapers that Google loves.
authorities did operate a facility; these were UAs who each operated a waste transfer stations.<br />
Two of the five waste transfer stations were on the river (Northumberland Wharf and Walbrook<br />
Wharf).<br />
The collection authorities were then asked about how waste is transported. Of the 17<br />
authorities that answered this question, over half (i.e. 13) used exclusively diesel fuelled lorries.<br />
(8 WCAs and 5 UAs). However, four authorities used alternative fuels to a greater or lesser<br />
extent as follows:<br />
• One WCA used exclusively LPG fuelled lorries.<br />
• One UA used up to 25% LPG and remainder was diesel.<br />
• One UA had up to 10% of its wastes transported by a combination of LPG and<br />
battery fuelled vehicles.<br />
• One WCA used up to 5% of vehicles fuelled by LPG.<br />
Respondents were then asked to provide information on waste tonnages for commercial and<br />
industrial wastes collected within their borough in 2002/3. Two authorities did not answer this<br />
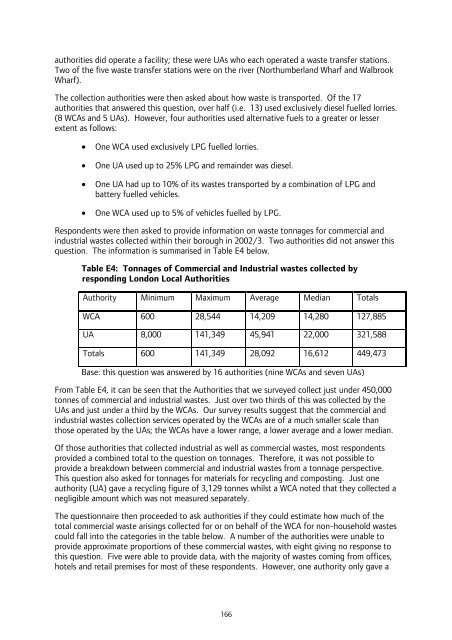
question. The information is summarised in Table E4 below.<br />
Table E4: Tonnages of Commercial and Industrial wastes collected by<br />
responding <strong>London</strong> Local Authorities<br />
<strong>Authority</strong> Minimum Maximum Average Median Totals<br />
WCA 600 28,544 14,209 14,280 127,885<br />
UA 8,000 141,349 45,941 22,000 321,588<br />
Totals 600 141,349 28,092 16,612 449,473<br />
Base: this question was answered by 16 authorities (nine WCAs and seven UAs)<br />
From Table E4, it can be seen that the Authorities that we surveyed collect just under 450,000<br />
tonnes of commercial and industrial wastes. Just over two thirds of this was collected by the<br />
UAs and just under a third by the WCAs. Our survey results suggest that the commercial and<br />
industrial wastes collection services operated by the WCAs are of a much smaller scale than<br />
those operated by the UAs; the WCAs have a lower range, a lower average and a lower median.<br />
Of those authorities that collected industrial as well as commercial wastes, most respondents<br />
provided a combined total to the question on tonnages. Therefore, it was not possible to<br />
provide a breakdown between commercial and industrial wastes from a tonnage perspective.<br />
This question also asked for tonnages for materials for recycling and composting. Just one<br />
authority (UA) gave a recycling figure of 3,129 tonnes whilst a WCA noted that they collected a<br />
negligible amount which was not measured separately.<br />
The questionnaire then proceeded to ask authorities if they could estimate how much of the<br />
total commercial waste arisings collected for or on behalf of the WCA for non-household wastes<br />
could fall into the categories in the table below. A number of the authorities were unable to<br />
provide approximate proportions of these commercial wastes, with eight giving no response to<br />
this question. Five were able to provide data, with the majority of wastes coming from offices,<br />
hotels and retail premises for most of these respondents. However, one authority only gave a<br />
166


