

London Wider Waste Strategy - London - Greater London Authority
London Wider Waste Strategy - London - Greater London Authority
London Wider Waste Strategy - London - Greater London Authority

You also want an ePaper? Increase the reach of your titles
YUMPU automatically turns print PDFs into web optimized ePapers that Google loves.
wastes to <strong>London</strong> are the closest, i.e. the South East (9,900 tonnes) and the East of<br />
England (9,600 tonnes) (2002 figures). Exports from all other regions are relatively<br />
insignificant.<br />
6.36. Hazardous waste imports and exports cannot be broken down further into waste<br />
categories as the 2002 data is currently only available as summary sheets and cannot be<br />
analysed in more detail using the Environment Agency <strong>Waste</strong> Interrogator.<br />
6.37. As an aid to gaining an understanding of <strong>London</strong>’s current hazardous waste treatment<br />
industry, import data from the Environment Agency hazardous waste interrogator was<br />
analysed. The assumption was that any hazardous waste being imported into <strong>London</strong> -<br />
although the amounts are relatively small (as outlined above in paragraph 6.33) - would<br />
give an indication of the types of hazardous waste treatment facilities in <strong>London</strong>. The<br />
information below is based on 2001 data, the most recent data available for<br />
interrogation.<br />
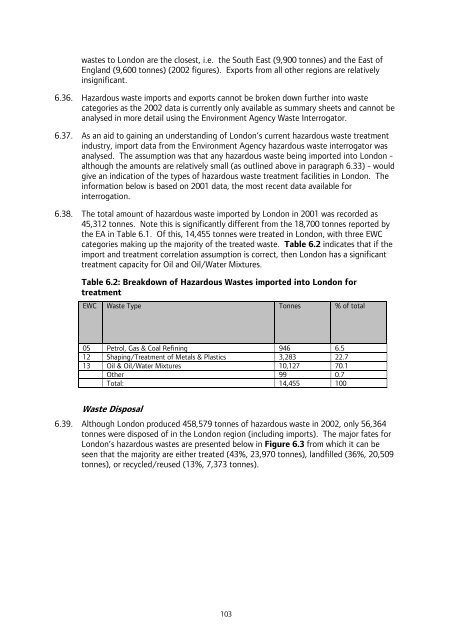
6.38. The total amount of hazardous waste imported by <strong>London</strong> in 2001 was recorded as<br />
45,312 tonnes. Note this is significantly different from the 18,700 tonnes reported by<br />
the EA in Table 6.1. Of this, 14,455 tonnes were treated in <strong>London</strong>, with three EWC<br />
categories making up the majority of the treated waste. Table 6.2 indicates that if the<br />
import and treatment correlation assumption is correct, then <strong>London</strong> has a significant<br />
treatment capacity for Oil and Oil/Water Mixtures.<br />
Table 6.2: Breakdown of Hazardous <strong>Waste</strong>s imported into <strong>London</strong> for<br />
treatment<br />
EWC <strong>Waste</strong> Type Tonnes % of total<br />
05 Petrol, Gas & Coal Refining 946 6.5<br />
12 Shaping/Treatment of Metals & Plastics 3,283 22.7<br />
13 Oil & Oil/Water Mixtures 10,127 70.1<br />
Other 99 0.7<br />
Total: 14,455 100<br />
<strong>Waste</strong> Disposal<br />
6.39. Although <strong>London</strong> produced 458,579 tonnes of hazardous waste in 2002, only 56,364<br />
tonnes were disposed of in the <strong>London</strong> region (including imports). The major fates for<br />
<strong>London</strong>’s hazardous wastes are presented below in Figure 6.3 from which it can be<br />
seen that the majority are either treated (43%, 23,970 tonnes), landfilled (36%, 20,509<br />
tonnes), or recycled/reused (13%, 7,373 tonnes).<br />
103


