- Page 1 and 2:
National Environmental Research Ins
- Page 3 and 4:
National Environmental Research Ins
- Page 5 and 6:
Contents Executive summary 9 ES.1.
- Page 7 and 8:
4.3 Chemical industry (2B) 122 4.3.
- Page 9 and 10:
8.3.6 Recalculations 209 8.3.7 Plan
- Page 11 and 12:
Executive summary ES.1. Background
- Page 13 and 14:
electricity. Also lower outdoor tem
- Page 15 and 16:
• The GHG emission inventories fo
- Page 17 and 18:
effekten af de forskellige drivhusg
- Page 19 and 20:
Som beskrevet i rapportens kapitel
- Page 21 and 22:
1 Introduction 1.1 Background infor
- Page 23 and 24:
The role of the European Union The
- Page 25 and 26:
Table 1.1 List of current data stru
- Page 27 and 28:
1.4 Brief general description of me
- Page 29 and 30:
1A2f (Industry-other), 1A3a (Civil
- Page 31 and 32:
is calculated. It is found that tha
- Page 33 and 34:
(see the reference list at Chapter
- Page 35 and 36:
1 Quality control (QC) Quality plan
- Page 37 and 38:
The different CCP’s are not indep
- Page 39 and 40:
When new data are introduced they c
- Page 41 and 42:
Inventory report for year 3 Invento
- Page 43 and 44:
The uncertainty on N 2 O from stati
- Page 45 and 46:
1.8 General assessment of the compl
- Page 47 and 48:
2 Trends in Greenhouse Gas Emission
- Page 49 and 50:
to change in traditional stable sys
- Page 51 and 52:
from national fishing and off-road
- Page 53 and 54:
3 Energy (CRF sector 1) 3.1 Overvie
- Page 55 and 56:
Table 3.3 CH 4 emission from the en
- Page 57 and 58:
Fuel consumption time-series for st
- Page 59 and 60:
Degree days Fuel consumption adjust
- Page 61 and 62:
Table 3.7 CO 2 emission from subsec
- Page 63 and 64:
The CH 4 emission from stationary c
- Page 65 and 66:
3.2.1.3.4 SO , NO , NMVOC and CO 2
- Page 67 and 68:
The fuel consumption of area source
- Page 69 and 70:
Table 3.12 CH 4 emission factors 19
- Page 71 and 72:
− Gruijthuijsen & Jensen 2000 −
- Page 73 and 74:
ues from Pulles & Aardenne 2001. Th
- Page 75 and 76:
• Disaggregation of fuel consumpt
- Page 77 and 78:
3.3.1.1 Fuel consumption Table 3.18
- Page 79 and 80:
3-@ 90 80 70 60 50 40 30 20 10 0 19
- Page 81 and 82:
1,4 1,2 1,0 0,8 0,6 0,4 0,2 0,0 198
- Page 83 and 84:
Table 3.19 Emissions of CO 2 , CH 4
- Page 85 and 86:
Passenger cars 56% Passenger cars 8
- Page 87 and 88:
WRQV@ 120 100 80 60 40 20 0 1985 19
- Page 89 and 90:
70000 60000 50000 40000 30000 20000
- Page 91 and 92:
The NO X emission trend for Agricul
- Page 93 and 94:
Bunkers The most important emission
- Page 95 and 96: Ã Ã Ã Ã Ã Ã
- Page 97 and 98: age the emissions from catalyst car
- Page 99 and 100: Where S C is the soak emission, l t
- Page 101 and 102: 3.3.2.2 Methodologies and reference
- Page 103 and 104: Table 3.26 Fuel specific emission f
- Page 105 and 106: Where E = emission, FC = fuel consu
- Page 107 and 108: For non-road machinery and working
- Page 109 and 110: Emission factors The Danish greenho
- Page 111 and 112: A comparison of the national approa
- Page 113 and 114: ( , 4 = = ( ; 4 + ( , 4 −2
- Page 115 and 116: In the 1990-1999 inventories fugiti
- Page 117 and 118: Table 3.38 Uncertainty, CRF sector
- Page 119 and 120: 4 Industrial processes (CRF Sector
- Page 121 and 122: The time-series for emission of CO
- Page 123 and 124: 4.2.5 Recalculations No source spec
- Page 125 and 126: 4.4 Metal production (2C) 4.4.1 Sou
- Page 127 and 128: Table 4.8 Consumption of HFCs in fo
- Page 129 and 130: The potential emissions have been c
- Page 131 and 132: cedure consisted of a check of the
- Page 133 and 134: Danish Environmental Protection Age
- Page 135 and 136: Table 5.1 Emission of chemicals in
- Page 137 and 138: 5.2.2 Methodological issues The emi
- Page 139 and 140: (ii) Collection of data for quantif
- Page 141 and 142: 6 The emission of greenhouse gases
- Page 143 and 144: Table 6.2 List of institutes involv
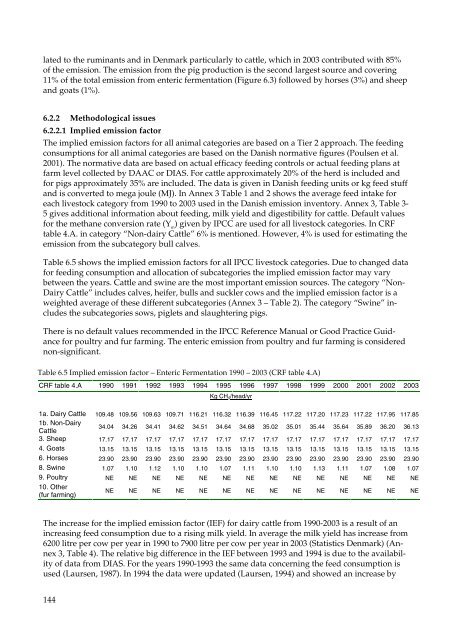
- Page 145: NERI receives the data from differe
- Page 149 and 150: 6.3.2 Methodological issues 6.3.2.1
- Page 151 and 152: Table 6.11 Nitrogen excretion, annu
- Page 153 and 154: Table 6.14 Emissions factor - N 2 O
- Page 155 and 156: 153
- Page 157 and 158: Table 6.20 Emissions from crop resi
- Page 159 and 160: Ã Ã Ã Ã Ã 80
- Page 161 and 162: 6.5 NMVOC emission Less than 1% of
- Page 163 and 164: • This years data delivery agreem
- Page 165 and 166: Husted, 1994: Waste Management, Sea
- Page 167 and 168: 7 The Specific methodologies regard
- Page 169 and 170: In 1990, the forested area with tre
- Page 171 and 172: inventory will be quite similar to
- Page 173 and 174: Table 7.4 Data on gross uptake of C
- Page 175 and 176: place during the first 30 years fol
- Page 177 and 178: 7.2.5 Recalculations Since the subm
- Page 179 and 180: Table 7.8 Agricultural areas in Den
- Page 181 and 182: 7.3.2.1 Emission from mineral soils
- Page 183 and 184: Table 7.17 C-emission from organic
- Page 185 and 186: Table 7.19 Area classification of t
- Page 187 and 188: The LULUCF sector contributes to a
- Page 189 and 190: Schöne, D. and Schulte, A. (1999).
- Page 191 and 192: Table A2.3 ÃÃÃÃÃÃÃÃÃÃ
- Page 193 and 194: As a result the sectoral total in C
- Page 195 and 196: Since, the Danish SWDSs are well-ma
- Page 197 and 198:
Table 8.8. Amounts of waste and CH
- Page 199 and 200:
Combustible” and “Other not Com
- Page 201 and 202:
which disaggregation level that can
- Page 203 and 204:
tion, technical upgrades of the WWT
- Page 205 and 206:
assuming that the treatment is 100%
- Page 207 and 208:
intermediate of both processes. Dan
- Page 209 and 210:
Table 8.19. Uncertainties for main
- Page 211 and 212:
In general country-specific TOW val
- Page 213 and 214:
Danish Environmental Protection Age
- Page 215 and 216:
9 Other (CRF sector 7) Chapter 9 is
- Page 217 and 218:
Table 10.1 Recalculation performed
- Page 219 and 220:
Table 10.2. Recalculation performed
- Page 221 and 222:
For the Industrial Sector uncertain
- Page 223 and 224:
Annex 1 Key source analyses Descrip
- Page 225 and 226:
7KH UHVXOW RI WKH NH\ VRXUFH DQDO\V
- Page 227 and 228:
7DEOHV $ ± $ RI WKH *RRG 3UDFWLFH
- Page 229 and 230:
Table 3. Key source analysis 1990-2
- Page 231 and 232:
Annex 3 Other detailed methodologic
- Page 233 and 234:
1 Introduction The Danish atmospher
- Page 235 and 236:
Stationary combustion plants are in
- Page 237 and 238:
Emissions from non-energy use of fu
- Page 239 and 240:
Coke oven coke The emission factor
- Page 241 and 242:
Kerosene The emission factor 72 kg/
- Page 243 and 244:
Illerup 2003. The estimated emissio
- Page 245 and 246:
The emission factor for CHP plants
- Page 247 and 248:
− Fuel consumption for transport.
- Page 249 and 250:
tricity trade, fuel consumption and
- Page 251 and 252:
Figure 3A-6 depicts the time-series
- Page 253 and 254:
1A4a Commercial / Institutional 2%
- Page 255 and 256:
CO 2 [Tg] 60 50 40 30 20 10 0 1990
- Page 257 and 258:
Other stationary combustion plants
- Page 259 and 260:
1A4a Commercial / Institutional 2%
- Page 261 and 262:
only accounted for a small portion
- Page 263 and 264:
Electricity and heat production is
- Page 265 and 266:
The use of wood in residential boil
- Page 267 and 268:
straw consumption in residential pl
- Page 269 and 270:
• The IPCC reference approach val
- Page 271 and 272:
Table 3A-21 Key sources, stationary
- Page 273 and 274:
emission are N 2 O emission (all pl
- Page 275 and 276:
enewable fuels has increased. The D
- Page 277 and 278:
Jørgensen, L. & Johansen, L. P. 20
- Page 279 and 280:
Appendix 3A-1 The Danish emission i
- Page 281 and 282:
030203 Blast furnace cowpers 1A2a 0
- Page 283 and 284:
Table 3A-28 Detailed fuel consumpti
- Page 285 and 286:
1A2f 118 SEWAGE SLUDGE 030311 40162
- Page 287 and 288:
Appendix 3A-4 Emission factors Tabl
- Page 289 and 290:
Table 3A-33 N 2 O emission factors
- Page 291 and 292:
7. Bjerrum M., 2002. Danish Technol
- Page 293 and 294:
NOX NATURAL GAS 010105 1A1a 276 241
- Page 295 and 296:
019 Enstedvaerket 04 010101 204 GAS
- Page 297 and 298:
Table 3A-39 Large point sources, pl
- Page 299 and 300:
Appendix 3A-6 Uncertainty estimates
- Page 301 and 302:
Table 3A-42 Uncertainty estimation,
- Page 303 and 304:
Table 3A-47 Uncertainty estimation,
- Page 305 and 306:
Table 3A-49 Fuel category correspon
- Page 307 and 308:
Appendix 3A-9 Reference approach Ã
- Page 309 and 310:
Table 3A-51 Fuel category correspon
- Page 311 and 312:
20201 - - - - - - - - - - - - - - -
- Page 313 and 314:
Passenger Cars Diesel >2.0 l Euro I
- Page 315 and 316:
Passenger Cars Gasoline 2.0 l Euro
- Page 317 and 318:
Buses Urban Buses Conventional 0 19
- Page 319 and 320:
Sector Subsector Tech FYear LYear 1
- Page 321 and 322:
Sector Subsector Tech FYear LYear 1
- Page 323 and 324:
Sector Subsector Tech FYear LYear 1
- Page 325 and 326:
Sector Subsector Tech FCu FCr FCh C
- Page 327 and 328:
Sector Subsector Tech COu COr COh N
- Page 329 and 330:
Sector Subsector Tech COuR COrR COh
- Page 331 and 332:
Annex 3B-5: Fuel use factors (MJ/km
- Page 333 and 334:
2-wheelers 1999 1.195 1.264 1.578 8
- Page 335 and 336:
2-wheelers 1991 6.249 4.379 2.011 6
- Page 337 and 338:
2002 Heavy Duty Vehicles 37849451 8
- Page 339 and 340:
Annex 3B-7: COPERT III:DEA statisti
- Page 341 and 342:
0808 Excavators (wheel type) 1000 1
- Page 343 and 344:
0808 Forklifts 5-10 tons (diesel) 0
- Page 345 and 346:
0809 Trimmers 60000 0.8 0.5 15 10 1
- Page 347 and 348:
1990 80502 Air traffic. other airpo
- Page 349 and 350:
2003 80403 Fishing Kerosene 731 4.6
- Page 351 and 352:
Year Category Mode SO2 NOx NMVOC CH
- Page 353 and 354:
Pollutant CRF ID Unit 1985 1986 198
- Page 355 and 356:
Pollutant CRF ID Unit 1985 1986 198
- Page 357 and 358:
Uncertainty estimation, CH 4 Gas Ba
- Page 359 and 360:
Uncertainty estimation, N 2 O IPCC
- Page 361 and 362:
Table. Production of Lime/Hydrated
- Page 363 and 364:
Suckling cattle 170.2 Swine Average
- Page 365 and 366:
7DEOH 'HWDLOHG LQIRUPDWLRQ UHODWHG
- Page 367 and 368:
7DEOH &KDQJHV LQ VWDEOH W\SH ± Liv
- Page 369 and 370:
Pullet, consumption, floor (100 pcs
- Page 371 and 372:
Annex 3E Solid Waste Disposal on La
- Page 373 and 374:
B = Biological N = Nitrification (r
- Page 375 and 376:
Table 3E.7. Stabilisation of sludge
- Page 377 and 378:
in Table 3E.9. Table 3E.9 Gross emi
- Page 379 and 380:
5HFRYHUHG &+ Ã HPLVVLRQV >*J@ 14.
- Page 381 and 382:
Annex 3F Solvents National Atmosphe
- Page 383 and 384:
83 1-ethyl-2,2,6-trimethylcyclohexa
- Page 385 and 386:
191 2-methoxy-2-methylpropane 192 2
- Page 387 and 388:
299 acetaldehyde 300 acetic acid 30
- Page 389 and 390:
407 cyclopentane 408 cyclopenta-phe
- Page 391 and 392:
515 methyl naphthalenes 516 methyl
- Page 393 and 394:
624 trans-3-hexene 625 trialkyl pho
- Page 395 and 396:
Annex 5 Assessment of completeness
- Page 397 and 398:
Annex 6.1 Annex 6.1. Additional inf
- Page 399 and 400:
Table A6.1.2 ÃÃÃÃ Kingdom DK Ã
- Page 401 and 402:
Table A6.1.4 ÃÃÃÃÃÃÃÃÃ Kin
- Page 403 and 404:
Annex 6.2 Additional information to
- Page 405 and 406:
Annex 7 Table 6.1 and 6.2 of the IP
- Page 407 and 408:
Annex 8 Other annexes - (Any other
- Page 409 and 410:
PM 2.2: An explicit description in
- Page 411 and 412:
Correctness The data at level 3 has
- Page 413 and 414:
Level 6 Transparency The background
- Page 415 and 416:
Table A9.1 ÃÃÃÃ Denmark ÃÃÃ
- Page 417 and 418:
Table A9.3 ÃÃÃÃ Denmark ÃÃÃ