

Denmark's National Inventory Report 2005 - Submitted under the ...
Denmark's National Inventory Report 2005 - Submitted under the ...
Denmark's National Inventory Report 2005 - Submitted under the ...

You also want an ePaper? Increase the reach of your titles
YUMPU automatically turns print PDFs into web optimized ePapers that Google loves.
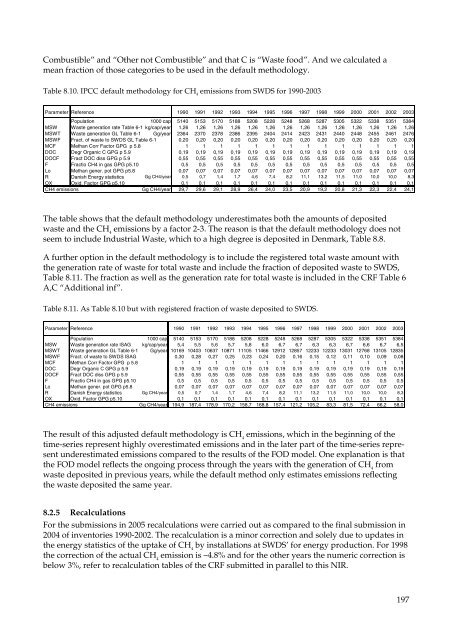
Combustible” and “O<strong>the</strong>r not Combustible” and that C is “Waste food”. And we calculated a<br />
mean fraction of those categories to be used in <strong>the</strong> default methodology.<br />
Table 8.10. IPCC default methodology for CH 4 emissions from SWDS for 1990-2003<br />
Parameter Reference 1990 1991 1992 1993 1994 1995 1996 1997 1998 1999 2000 2001 2002 2003<br />
Population 1000 cap 5140 5153 5170 5188 5208 5228 5248 5268 5287 5305 5322 5338 5351 5384<br />
MSW Waste generation rate Table 6-1 kg/cap/year 1,26 1,26 1,26 1,26 1,26 1,26 1,26 1,26 1,26 1,26 1,26 1,26 1,26 1,26<br />
MSWT Waste generation GL Table 6-1 Gg/year 2364 2370 2378 2386 2395 2404 2414 2423 2431 2440 2448 2455 2461 2476<br />
MSWF Fract. of waste to SWDS GL Table 6-1 0,20 0,20 0,20 0,20 0,20 0,20 0,20 0,20 0,20 0,20 0,20 0,20 0,20 0,20<br />
MCF Methan Corr Factor GPG p 5.8 1 1 1 1 1 1 1 1 1 1 1 1 1 1<br />
DOC Degr Organic C GPG p 5.9 0,19 0,19 0,19 0,19 0,19 0,19 0,19 0,19 0,19 0,19 0,19 0,19 0,19 0,19<br />
DOCF Fract DOC diss GPG p 5.9 0,55 0,55 0,55 0,55 0,55 0,55 0,55 0,55 0,55 0,55 0,55 0,55 0,55 0,55<br />
F Fractio CH4 in gas GPG p5.10 0,5 0,5 0,5 0,5 0,5 0,5 0,5 0,5 0,5 0,5 0,5 0,5 0,5 0,5<br />
Lo Methan gener. pot GPG p5.8 0,07 0,07 0,07 0,07 0,07 0,07 0,07 0,07 0,07 0,07 0,07 0,07 0,07 0,07<br />
R Danish Energy statistics Gg CH4/year 0,5 0,7 1,4 1,7 4,6 7,4 8,2 11,1 13,2 11,5 11,0 10,0 10,0 8,3<br />
OX Oxid. Factor GPG p5.10 0,1 0,1 0,1 0,1 0,1 0,1 0,1 0,1 0,1 0,1 0,1 0,1 0,1 0,1<br />
CH4 emissions Gg CH4/year 29,7 29,6 29,1 28,9 26,4 24,0 23,5 20,9 19,2 20,8 21,3 22,3 22,4 24,1<br />
The table shows that <strong>the</strong> default methodology <strong>under</strong>estimates both <strong>the</strong> amounts of deposited<br />
waste and <strong>the</strong> CH 4 emissions by a factor 2-3. The reason is that <strong>the</strong> default methodology does not<br />
seem to include Industrial Waste, which to a high degree is deposited in Denmark, Table 8.8.<br />
A fur<strong>the</strong>r option in <strong>the</strong> default methodology is to include <strong>the</strong> registered total waste amount with<br />
<strong>the</strong> generation rate of waste for total waste and include <strong>the</strong> fraction of deposited waste to SWDS,<br />
Table 8.11. The fraction as well as <strong>the</strong> generation rate for total waste is included in <strong>the</strong> CRF Table 6<br />
A,C “Additional inf”.<br />
Table 8.11. As Table 8.10 but with registered fraction of waste deposited to SWDS.<br />
Parameter Reference 1990 1991 1992 1993 1994 1995 1996 1997 1998 1999 2000 2001 2002 2003<br />
Population 1000 cap 5140 5153 5170 5188 5208 5228 5248 5268 5287 5305 5322 5338 5351 5384<br />
MSW Waste generation rate ISAG kg/cap/year 5,4 5,5 5,6 5,7 5,8 6,0 6,7 6,7 6,3 6,3 6,7 6,6 6,7 6,5<br />
MSWT Waste generation GL Table 6-1 Gg/year 10169 10403 10637 10871 11105 11466 12912 12857 12233 12233 13031 12768 13105 12835<br />
MSWF Fract. of waste to SWDS ISAG 0,30 0,28 0,27 0,25 0,23 0,24 0,20 0,16 0,15 0,12 0,11 0,10 0,09 0,08<br />
MCF Methan Corr Factor GPG p 5.8 1 1 1 1 1 1 1 1 1 1 1 1 1 1<br />
DOC Degr Organic C GPG p 5.9 0,19 0,19 0,19 0,19 0,19 0,19 0,19 0,19 0,19 0,19 0,19 0,19 0,19 0,19<br />
DOCF Fract DOC diss GPG p 5.9 0,55 0,55 0,55 0,55 0,55 0,55 0,55 0,55 0,55 0,55 0,55 0,55 0,55 0,55<br />
F Fractio CH4 in gas GPG p5.10 0,5 0,5 0,5 0,5 0,5 0,5 0,5 0,5 0,5 0,5 0,5 0,5 0,5 0,5<br />
Lo Methan gener. pot GPG p5.8 0,07 0,07 0,07 0,07 0,07 0,07 0,07 0,07 0,07 0,07 0,07 0,07 0,07 0,07<br />
R Danish Energy statistics Gg CH4/year 0,5 0,7 1,4 1,7 4,6 7,4 8,2 11,1 13,2 11,5 11,0 10,0 10,0 8,3<br />
OX Oxid. Factor GPG p5.10 0,1 0,1 0,1 0,1 0,1 0,1 0,1 0,1 0,1 0,1 0,1 0,1 0,1 0,1<br />
CH4 emissions Gg CH4/year 194,9 187,4 178,9 170,2 158,7 168,8 157,4 121,2 105,2 83,3 81,5 72,4 66,2 58,0<br />
The result of this adjusted default methodology is CH 4 emissions, which in <strong>the</strong> beginning of <strong>the</strong><br />
time-series represent highly overestimated emissions and in <strong>the</strong> later part of <strong>the</strong> time-series represent<br />
<strong>under</strong>estimated emissions compared to <strong>the</strong> results of <strong>the</strong> FOD model. One explanation is that<br />
<strong>the</strong> FOD model reflects <strong>the</strong> ongoing process through <strong>the</strong> years with <strong>the</strong> generation of CH 4 from<br />
waste deposited in previous years, while <strong>the</strong> default method only estimates emissions reflecting<br />
<strong>the</strong> waste deposited <strong>the</strong> same year.<br />
8.2.5 Recalculations<br />
For <strong>the</strong> submissions in <strong>2005</strong> recalculations were carried out as compared to <strong>the</strong> final submission in<br />
2004 of inventories 1990-2002. The recalculation is a minor correction and solely due to updates in<br />
<strong>the</strong> energy statistics of <strong>the</strong> uptake of CH by installations at SWDS’ for energy production. For 1998<br />
4<br />
<strong>the</strong> correction of <strong>the</strong> actual CH emission is –4.8% and for <strong>the</strong> o<strong>the</strong>r years <strong>the</strong> numeric correction is<br />
4<br />
below 3%, refer to recalculation tables of <strong>the</strong> CRF submitted in parallel to this NIR.<br />
197


