

Denmark's National Inventory Report 2005 - Submitted under the ...
Denmark's National Inventory Report 2005 - Submitted under the ...
Denmark's National Inventory Report 2005 - Submitted under the ...

You also want an ePaper? Increase the reach of your titles
YUMPU automatically turns print PDFs into web optimized ePapers that Google loves.
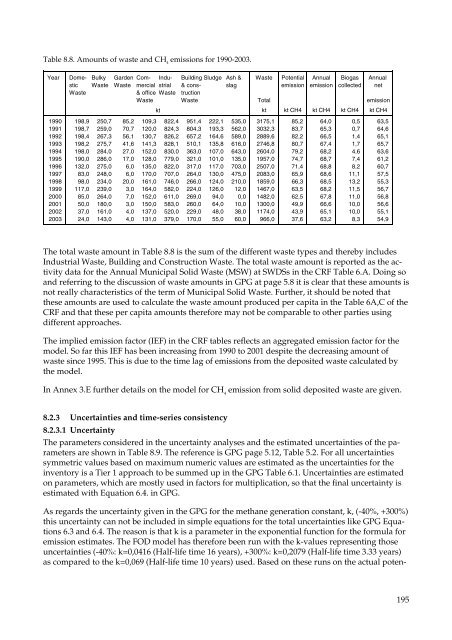
Table 8.8. Amounts of waste and CH 4 emissions for 1990-2003.<br />
Year Dome- Bulky Garden Com- Indu- Building Sludge Ash & Waste Potential Annual Biogas Annual<br />
stic Waste Waste mercial strial & cons- slag emission emission collected net<br />
Waste & office Waste truction<br />
Waste Waste Total emission<br />
kt<br />
kt kt CH4 kt CH4 kt CH4 kt CH4<br />
1990 198,9 250,7 85,2 109,3 822,4 951,4 222,1 535,0 3175,1 85,2 64,0 0,5 63,5<br />
1991 198,7 259,0 70,7 120,0 824,3 804,3 193,3 562,0 3032,3 83,7 65,3 0,7 64,6<br />
1992 198,4 267,3 56,1 130,7 826,2 657,2 164,6 589,0 2889,6 82,2 66,5 1,4 65,1<br />
1993 198,2 275,7 41,6 141,3 828,1 510,1 135,8 616,0 2746,8 80,7 67,4 1,7 65,7<br />
1994 198,0 284,0 27,0 152,0 830,0 363,0 107,0 643,0 2604,0 79,2 68,2 4,6 63,6<br />
1995 190,0 286,0 17,0 128,0 779,0 321,0 101,0 135,0 1957,0 74,7 68,7 7,4 61,2<br />
1996 132,0 275,0 6,0 135,0 822,0 317,0 117,0 703,0 2507,0 71,4 68,8 8,2 60,7<br />
1997 83,0 248,0 6,0 170,0 707,0 264,0 130,0 475,0 2083,0 65,9 68,6 11,1 57,5<br />
1998 98,0 234,0 20,0 161,0 746,0 266,0 124,0 210,0 1859,0 66,3 68,5 13,2 55,3<br />
1999 117,0 239,0 3,0 164,0 582,0 224,0 126,0 12,0 1467,0 63,5 68,2 11,5 56,7<br />
2000 85,0 264,0 7,0 152,0 611,0 269,0 94,0 0,0 1482,0 62,5 67,8 11,0 56,8<br />
2001 50,0 180,0 3,0 150,0 583,0 260,0 64,0 10,0 1300,0 49,9 66,6 10,0 56,6<br />
2002 37,0 161,0 4,0 137,0 520,0 229,0 48,0 38,0 1174,0 43,9 65,1 10,0 55,1<br />
2003 24,0 143,0 4,0 131,0 379,0 170,0 55,0 60,0 966,0 37,6 63,2 8,3 54,9<br />
The total waste amount in Table 8.8 is <strong>the</strong> sum of <strong>the</strong> different waste types and <strong>the</strong>reby includes<br />
Industrial Waste, Building and Construction Waste. The total waste amount is reported as <strong>the</strong> activity<br />
data for <strong>the</strong> Annual Municipal Solid Waste (MSW) at SWDSs in <strong>the</strong> CRF Table 6.A. Doing so<br />
and referring to <strong>the</strong> discussion of waste amounts in GPG at page 5.8 it is clear that <strong>the</strong>se amounts is<br />
not really characteristics of <strong>the</strong> term of Municipal Solid Waste. Fur<strong>the</strong>r, it should be noted that<br />
<strong>the</strong>se amounts are used to calculate <strong>the</strong> waste amount produced per capita in <strong>the</strong> Table 6A,C of <strong>the</strong><br />
CRF and that <strong>the</strong>se per capita amounts <strong>the</strong>refore may not be comparable to o<strong>the</strong>r parties using<br />
different approaches.<br />
The implied emission factor (IEF) in <strong>the</strong> CRF tables reflects an aggregated emission factor for <strong>the</strong><br />
model. So far this IEF has been increasing from 1990 to 2001 despite <strong>the</strong> decreasing amount of<br />
waste since 1995. This is due to <strong>the</strong> time lag of emissions from <strong>the</strong> deposited waste calculated by<br />
<strong>the</strong> model.<br />
In Annex 3.E fur<strong>the</strong>r details on <strong>the</strong> model for CH 4 emission from solid deposited waste are given.<br />
8.2.3 Uncertainties and time-series consistency<br />
8.2.3.1 Uncertainty<br />
The parameters considered in <strong>the</strong> uncertainty analyses and <strong>the</strong> estimated uncertainties of <strong>the</strong> parameters<br />
are shown in Table 8.9. The reference is GPG page 5.12, Table 5.2. For all uncertainties<br />
symmetric values based on maximum numeric values are estimated as <strong>the</strong> uncertainties for <strong>the</strong><br />
inventory is a Tier 1 approach to be summed up in <strong>the</strong> GPG Table 6.1. Uncertainties are estimated<br />
on parameters, which are mostly used in factors for multiplication, so that <strong>the</strong> final uncertainty is<br />
estimated with Equation 6.4. in GPG.<br />
As regards <strong>the</strong> uncertainty given in <strong>the</strong> GPG for <strong>the</strong> methane generation constant, k, (-40%, +300%)<br />
this uncertainty can not be included in simple equations for <strong>the</strong> total uncertainties like GPG Equations<br />
6.3 and 6.4. The reason is that k is a parameter in <strong>the</strong> exponential function for <strong>the</strong> formula for<br />
emission estimates. The FOD model has <strong>the</strong>refore been run with <strong>the</strong> k-values representing those<br />
uncertainties (-40%: k=0,0416 (Half-life time 16 years), +300%: k=0,2079 (Half-life time 3.33 years)<br />
as compared to <strong>the</strong> k=0,069 (Half-life time 10 years) used. Based on <strong>the</strong>se runs on <strong>the</strong> actual poten-<br />
195


