- Page 1 and 2: Center for Transportation Analysis
- Page 3: Users of the Transportation Energy
- Page 6 and 7: vi TABLE OF CONTENTS (Continued) Ta
- Page 8 and 9: viii TABLE OF CONTENTS (Continued)
- Page 10 and 11: x TABLE OF CONTENTS (Continued) CHA
- Page 12 and 13: xii TABLE OF CONTENTS (Continued) T
- Page 14 and 15: xiv TABLE OF CONTENTS (Continued) T
- Page 16 and 17: xvi TRANSPORTATION ENERGY DATA BOOK
- Page 18 and 19: xviii TRANSPORTATION ENERGY DATA BO
- Page 20 and 21: xx TRANSPORTATION ENERGY DATA BOOK:
- Page 24 and 25: 1-2 Although the world has consumed
- Page 26 and 27: 1-4 This table shows petroleum prod
- Page 28 and 29: 1-6 Figure 1.2. World Oil Reserves,
- Page 30 and 31: 1-8 This chart shows the volatility
- Page 32 and 33: 1-10 a First two quarters of 2001.
- Page 34 and 35: 1-12 Other parts of the world refin
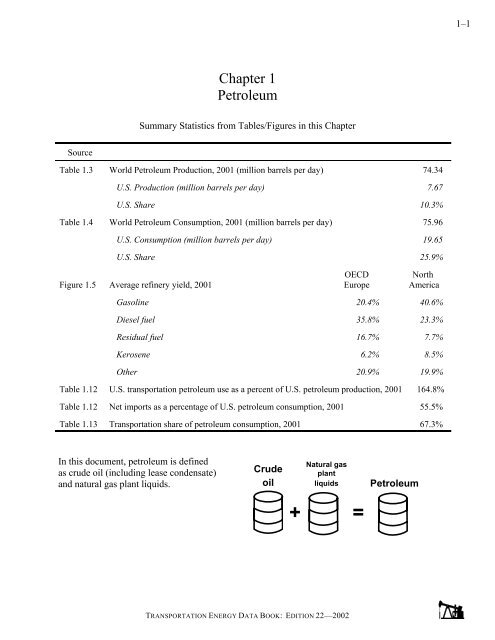
- Page 36 and 37: 1-14 When crude oil and other hydro
- Page 38 and 39: 1-16 The U.S. share of the world’
- Page 40 and 41: 1-18 Transportation accounts for mo
- Page 42 and 43: Source Chapter 2 Energy Summary Sta
- Page 44 and 45: The Energy Information Administrati
- Page 46 and 47: Oxygenates are blended with gasolin
- Page 48 and 49: The 1999 data have been revised to
- Page 50 and 51: About 22% of transportation energy
- Page 52 and 53: The Federal Highway Administration
- Page 54 and 55: Nearly all of the fuel ethanol used
- Page 56 and 57: Great care should be taken when com
- Page 58 and 59: Figure 2.3. Energy Intensities for
- Page 60 and 61: Great care should be taken when com
- Page 62 and 63: Chapter 3 Greenhouse Gas Emissions
- Page 64 and 65: Global Warming Potentials (GWP) wer
- Page 66 and 67: Gases which contain carbon can be m
- Page 68 and 69: The Greenhouse Gases, Regulated Emi
- Page 70 and 71: GV: FRFG (btu/mile or grams/mile) T
- Page 72 and 73:
Source Chapter 4 Criteria Air Pollu
- Page 74 and 75:
The transportation sector accounted
- Page 76 and 77:
The transportation sector accounted
- Page 78 and 79:
The transportation sector accounted
- Page 80 and 81:
The transportation sector accounted
- Page 82 and 83:
The transportation sector accounted
- Page 84 and 85:
Historically, the transportation se
- Page 86 and 87:
Acronyms and Terms Used on Table 4.
- Page 88 and 89:
Table 4. 13 (Continued) Fuel-Cycle
- Page 90 and 91:
Table 4.14 Tier 2 Emission Standard
- Page 92 and 93:
TRANSPORTATION ENERGY DATA BOOK: ED
- Page 94 and 95:
Table 4.18 Federal Exhaust Emission
- Page 96 and 97:
TRANSPORTATION ENERGY DATA BOOK: ED
- Page 98 and 99:
TRANSPORTATION ENERGY DATA BOOK: ED
- Page 100 and 101:
California's Low-Emission Vehicle r
- Page 102 and 103:
TRANSPORTATION ENERGY DATA BOOK: ED
- Page 104 and 105:
TRANSPORTATION ENERGY DATA BOOK: ED
- Page 106 and 107:
5-6 Though the cost of crude oil ce
- Page 108 and 109:
5-8 The fuel prices shown here are
- Page 110 and 111:
5-10 Table 5.7 State Taxes on Motor
- Page 112 and 113:
5-12 As of January 2001, only five
- Page 114 and 115:
5-14 In current dollars, import car
- Page 116 and 117:
TRANSPORTATION ENERGY DATA BOOK: ED
- Page 118 and 119:
5-18 In 1999 there were 7.7 employe
- Page 120 and 121:
5-20 Eleven percent of employed civ
- Page 122 and 123:
TRANSPORTATION ENERGY DATA BOOK: ED
- Page 124 and 125:
6-4 VEHICLES IN USE Both the Federa
- Page 126 and 127:
6-6 The line on this graph shows th
- Page 128 and 129:
6-8 The trend of using two-axle, fo
- Page 130 and 131:
TRANSPORTATION ENERGY DATA BOOK: ED
- Page 132 and 133:
6-12 The average age of trucks (cla
- Page 134 and 135:
TRANSPORTATION ENERGY DATA BOOK: ED
- Page 136 and 137:
TRANSPORTATION ENERGY DATA BOOK: ED
- Page 138 and 139:
TRANSPORTATION ENERGY DATA BOOK: ED
- Page 140 and 141:
7-2 The Federal Highway Administrat
- Page 142 and 143:
7-4 Because data on Class 2b trucks
- Page 144 and 145:
7-6 In 2000, light trucks, which in
- Page 146 and 147:
7-8 Light truck sales have more tha
- Page 148 and 149:
7-10 This graph shows the emergence
- Page 150 and 151:
7-12 Table 7.11 Sales-Weighted Engi
- Page 152 and 153:
7-14 The sales-weighted interior sp
- Page 154 and 155:
7-16 The average auto lost over 300
- Page 156 and 157:
7-18 The number of conventional ref
- Page 158 and 159:
7-20 The Corporate Average Fuel Eco
- Page 160 and 161:
7-22 Consumers must pay the Gas Guz
- Page 162 and 163:
7-24 Fuel Economy by Vehicle Speed
- Page 164 and 165:
7-26 The two earlier studies by the
- Page 166 and 167:
7-28 Of the tested vehicles, the 19
- Page 168 and 169:
7-30 The New York Test Cycle was de
- Page 170 and 171:
7-32 Researchers at Argonne Nationa
- Page 172 and 173:
7-34 Total traffic fatalities were
- Page 174 and 175:
7-36 In 2000, nearly 38% of all pas
- Page 176 and 177:
Source Chapter 8 Heavy Vehicles and
- Page 178 and 179:
Combination trucks include all truc
- Page 180 and 181:
Vehicle Inventory and Use Survey Th
- Page 182 and 183:
As expected, most light trucks trav
- Page 184 and 185:
In 1997 nearly 60% of all truck fle
- Page 186 and 187:
Commodity Flow Survey The Commodity
- Page 188 and 189:
Industries covered by the 1997 Comm
- Page 190 and 191:
There are currently not many source
- Page 192 and 193:
9-2 Alternative Fuels The U.S. Depa
- Page 194 and 195:
9-4 Nearly 90% of private alternati
- Page 196 and 197:
9-6 This list includes public and p
- Page 198 and 199:
9-8 The Honda Insight, Civic Hybrid
- Page 200 and 201:
10-2 Significant changes have been
- Page 202 and 203:
10-4 The average length of service
- Page 204 and 205:
10-6 Table 10.5 Federal Government
- Page 206 and 207:
10-8 The Energy Policy Act of 1992
- Page 208 and 209:
11-2 Vehicle-miles are growing at a
- Page 210 and 211:
TRANSPORTATION ENERGY DATA BOOK: ED
- Page 212 and 213:
11-6 1995 Nationwide Personal Trans
- Page 214 and 215:
11-8 The 1995 NPTS data should be c
- Page 216 and 217:
11-10 Vans and sport utility vehicl
- Page 218 and 219:
11-12 Less than 27% of all househol
- Page 220 and 221:
11-14 Historically, the data from t
- Page 222 and 223:
11-16 According to the U.S. Census
- Page 224 and 225:
11-18 Sales of bicycles with wheel
- Page 226 and 227:
11-20 1995 American Travel Survey T
- Page 228 and 229:
11-22 Those with a household income
- Page 230 and 231:
TRANSPORTATION ENERGY DATA BOOK: ED
- Page 232 and 233:
12-4 In the early seventies, domest
- Page 234 and 235:
TRANSPORTATION ENERGY DATA BOOK: ED
- Page 236 and 237:
12-8 The Interstate Commerce Commis
- Page 238 and 239:
12-10 The “other” category, whi
- Page 240 and 241:
12-12 The National Railroad Passeng
- Page 242 and 243:
12-14 This table on transit rail op
- Page 244 and 245:
A-2 List of Abbreviations Used in A
- Page 246 and 247:
A-4 Motorcycles Buses DOT, FHWA, Hi
- Page 248 and 249:
A-6 Trucks Light Trucks: DOT, FHWA,
- Page 250 and 251:
A-8 Off-highway energy use Diesel:
- Page 252 and 253:
A-10 Domestic and International Air
- Page 254 and 255:
A-12 Recreational Boating: Fuel use
- Page 256 and 257:
A-14 Year Natural gas (million cubi
- Page 258 and 259:
A-16 Passenger: Commuter - APTA, 20
- Page 260 and 261:
A-18 Calculation of Million Barrels
- Page 262 and 263:
A-20 Motorcycles Number of vehicles
- Page 264 and 265:
A-22 Transit Number of vehicles, ve
- Page 266 and 267:
A-24 Light trucks Btu per vehicle-m
- Page 268 and 269:
A-26 Truck Freight Movement and Ene
- Page 270 and 271:
A-28 Automobiles Highway Vehicle St
- Page 272 and 273:
A-30 Then, the number of trucks in
- Page 274 and 275:
A-32 Sales - Domestic and import to
- Page 276 and 277:
A-34 Light Fleet Vehicle Travel Aut
- Page 278 and 279:
APPENDIX B CONVERSIONS A Note About
- Page 280 and 281:
Table B.2 Fuel Equivalents 1 millio
- Page 282 and 283:
Table B.5 Distance and Velocity Con
- Page 284 and 285:
FROM Horsepower Kilowatts Table B.8
- Page 286 and 287:
Table B.10 Fuel Efficiency Conversi
- Page 288 and 289:
Table B.12 Metric Units and Abbrevi
- Page 290 and 291:
TRANSPORTATION ENERGY DATA BOOK: ED
- Page 292 and 293:
APPENDIX C CENSUS DIVISIONS AND REG
- Page 294 and 295:
TRANSPORTATION ENERGY DATA BOOK: ED
- Page 296 and 297:
GLOSSARY Acceleration power - Measu
- Page 298 and 299:
Bunkering fuels - Fuels stored in s
- Page 300 and 301:
Crude oil imports - The volume of c
- Page 302 and 303:
volume. There are other fuels that
- Page 304 and 305:
Kerosene - A petroleum distillate i
- Page 306 and 307:
Natural gas, wet: The volume of nat
- Page 308 and 309:
of petroleum products, and the prim
- Page 310 and 311:
Sales period - October 1 of the pre
- Page 312 and 313:
Vehicle Inventory and Use Survey -
- Page 314 and 315:
I-2 Acquisitions Federal Fleet Vehi
- Page 316 and 317:
I-4 Average Annual Expenditures of
- Page 318 and 319:
I-6 Certificated Summary Statistics
- Page 320 and 321:
I-8 Consumption (continued) U.S. Ca
- Page 322 and 323:
I-10 Distance Long-Distance Trips b
- Page 324 and 325:
I-12 Emissions World Carbon Emissio
- Page 326 and 327:
I-14 Exhaust (continued) Federal Ex
- Page 328 and 329:
I-16 Fuel-Cycle Energy and Greenhou
- Page 330 and 331:
I-18 Tax Receipts from the Sale of
- Page 332 and 333:
I-20 Tonnage Statistics for Domesti
- Page 334 and 335:
I-22 Vehicle-Miles by Trip Purpose,
- Page 336 and 337:
I-24 Occupant Fatalities by Vehicle
- Page 338 and 339:
I-26 PM PMT Policy United States Pe
- Page 340 and 341:
I-28 Summary Statistics for Commute
- Page 342 and 343:
I-30 versus Sales-Weighted Fuel Eco
- Page 344 and 345:
I-32 Federal Exhaust Emission Certi
- Page 346 and 347:
I-34 Surveys Growth of Freight in t
- Page 348 and 349:
I-36 Trips Truck Household 1969, 19
- Page 350 and 351:
I-38 Vehicle-Miles by Trip Purpose,
- Page 352:
I-40 Weighted Sales-Weighted Engine