

TRANSPORTATION ENERGY DATA BOOK: EDITION 22 - Center for ...
TRANSPORTATION ENERGY DATA BOOK: EDITION 22 - Center for ...
TRANSPORTATION ENERGY DATA BOOK: EDITION 22 - Center for ...

Create successful ePaper yourself
Turn your PDF publications into a flip-book with our unique Google optimized e-Paper software.
<strong>TRANSPORTATION</strong> <strong>ENERGY</strong> <strong>DATA</strong> <strong>BOOK</strong>: <strong>EDITION</strong> <strong>22</strong>—2002<br />
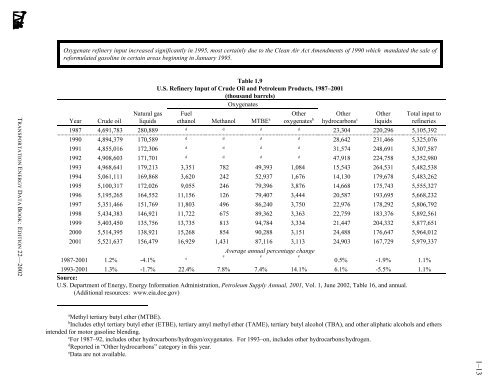
Oxygenate refinery input increased significantly in 1995, most certainly due to the Clean Air Act Amendments of 1990 which mandated the sale of<br />
re<strong>for</strong>mulated gasoline in certain areas beginning in January 1995.<br />
aMethyl tertiary butyl ether (MTBE).<br />
bIncludes ethyl tertiary butyl ether (ETBE), tertiary amyl methyl ether (TAME), tertiary butyl alcohol (TBA), and other aliphatic alcohols and ethers<br />
intended <strong>for</strong> motor gasoline blending.<br />
cFor 1987–92, includes other hydrocarbons/hydrogen/oxygenates. For 1993–on, includes other hydrocarbons/hydrogen.<br />
dReported in “Other hydrocarbons” category in this year.<br />
e Data are not available.<br />
Table 1.9<br />
U.S. Refinery Input of Crude Oil and Petroleum Products, 1987–2001<br />
(thousand barrels)<br />
Oxygenates<br />
Natural gas Fuel<br />
Year Crude oil liquids ethanol Methanol MTBEa Other<br />
oxygenatesb Other<br />
hydrocarbonsc Other Total input to<br />
liquids refineries<br />
1987 4,691,783 280,889 d d d d 23,304 <strong>22</strong>0,296 5,105,392<br />
1990 4,894,379 170,589 d d d d 28,642 231,466 5,325,076<br />
1991 4,855,016 172,306 d d d d 31,574 248,691 5,307,587<br />
1992 4,908,603 171,701 d d d d 47,918 <strong>22</strong>4,758 5,352,980<br />
1993 4,968,641 179,213 3,351 782 49,393 1,084 15,543 264,531 5,482,538<br />
1994 5,061,111 169,868 3,620 242 52,937 1,676 14,130 179,678 5,483,262<br />
1995 5,100,317 172,026 9,055 246 79,396 3,876 14,668 175,743 5,555,327<br />
1996 5,195,265 164,552 11,156 126 79,407 3,444 20,587 193,695 5,668,232<br />
1997 5,351,466 151,769 11,803 496 86,240 3,750 <strong>22</strong>,976 178,292 5,806,792<br />
1998 5,434,383 146,921 11,7<strong>22</strong> 675 89,362 3,363 <strong>22</strong>,759 183,376 5,892,561<br />
1999 5,403,450 135,756 13,735 813 94,784 3,334 21,447 204,332 5,877,651<br />
2000 5,514,395 138,921 15,268 854 90,288 3,151 24,488 176,647 5,964,012<br />
2001 5,521,637 156,479 16,929 1,431 87,116 3,113 24,903 167,729 5,979,337<br />
Average annual percentage change<br />
1987-2001 1.2% -4.1% e<br />
e e e<br />
0.5% -1.9% 1.1%<br />
1993-2001<br />
Source:<br />
1.3% -1.7% <strong>22</strong>.4% 7.8% 7.4% 14.1% 6.1% -5.5% 1.1%<br />
U.S. Department of Energy, Energy In<strong>for</strong>mation Administration, Petroleum Supply Annual, 2001, Vol. 1, June 2002, Table 16, and annual.<br />
(Additional resources: www.eia.doe.gov)<br />
1–13


