

TRANSPORTATION ENERGY DATA BOOK: EDITION 22 - Center for ...
TRANSPORTATION ENERGY DATA BOOK: EDITION 22 - Center for ...
TRANSPORTATION ENERGY DATA BOOK: EDITION 22 - Center for ...

Create successful ePaper yourself
Turn your PDF publications into a flip-book with our unique Google optimized e-Paper software.
<strong>TRANSPORTATION</strong> <strong>ENERGY</strong> <strong>DATA</strong> <strong>BOOK</strong>: <strong>EDITION</strong> <strong>22</strong>—2002<br />
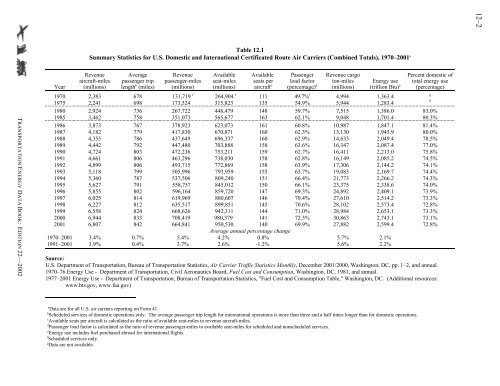
Table 12.1<br />
Summary Statistics <strong>for</strong> U.S. Domestic and International Certificated Route Air Carriers (Combined Totals), 1970–2001 a<br />
Revenue Average<br />
aircraft-miles passenger trip<br />
Year (millions) length b Revenue Available Available<br />
passenger-miles seat-miles seats per<br />
(miles) (millions) (millions) aircraft c<br />
Passenger<br />
load factor<br />
(percentage) d<br />
Revenue cargo<br />
ton-miles Energy use<br />
(millions) (trillion Btu) e<br />
Percent domestic of<br />
total energy use<br />
(percentage)<br />
1970 2,383 678 131,719 f 264,904 f 111 49.7% f 1975 2,241 698 173,324 315,823 135 54.9%<br />
4,994<br />
5,944<br />
1,363.4<br />
1,283.4<br />
g<br />
g<br />
1980 2,924 736 267,7<strong>22</strong> 448,479 148 59.7% 7,515 1,386.0 83.0%<br />
1985 3,462 758 351,073 565,677 163 62.1% 9,048 1,701.4 80.3%<br />
1986 3,873 767 378,923 623,073 161 60.8% 10,987 1,847.1 81.4%<br />
1987 4,182 779 417,830 670,871 160 62.3% 13,130 1,945.9 80.0%<br />
1988 4,355 786 437,649 696,337 160 62.9% 14,633 2,049.4 78.5%<br />
1989 4,442 792 447,480 703,888 158 63.6% 16,347 2,087.4 77.0%<br />
1990 4,724 803 472,236 753,211 159 62.7% 16,411 2,213.0 75.8%<br />
1991 4,661 806 463,296 738,030 158 62.8% 16,149 2,085.2 74.5%<br />
1992 4,899 806 493,715 772,869 158 63.9% 17,306 2,144.2 74.1%<br />
1993 5,118 799 505,996 793,959 155 63.7% 19,083 2,169.7 74.4%<br />
1994 5,360 787 537,506 809,240 151 66.4% 21,773 2,266.2 74.3%<br />
1995 5,627 791 558,757 845,012 150 66.1% 23,375 2,338.6 74.0%<br />
1996 5,855 802 596,164 859,720 147 69.3% 24,892 2,409.1 73.9%<br />
1997 6,025 814 619,969 880,607 146 70.4% 27,610 2,514.2 73.3%<br />
1998 6,<strong>22</strong>7 812 635,517 899,851 145 70.6% 28,102 2,573.4 72.8%<br />
1999 6,558 824 668,626 942,311 144 71.0% 28,984 2,653.1 73.3%<br />
2000 6,944 833 708,419 980,379 141 72.3% 30,863 2,743.1 73.1%<br />
2001 6,807 842 664,841 950,530 140 69.9% 27,882 2,599.4 72.8%<br />
Average annual percentage change<br />
1970–2001 3.4% 0.7% 5.4% 4.2% 0.8% 5.7% 2.1%<br />
1991–2001 3.9% 0.4% 3.7% 2.6% -1.2% 5.6% 2.2%<br />
Source:<br />
U.S. Department of Transportation, Bureau of Transportation Statistics, Air Carrier Traffic Statistics Monthly, December 2001/2000, Washington, DC, pp. 1–2, and annual.<br />
1970–76 Energy Use - Department of Transportation, Civil Aeronautics Board, Fuel Cost and Consumption, Washington, DC, 1981, and annual.<br />
1977–2001 Energy Use - Department of Transportation, Bureau of Transportation Statistics, "Fuel Cost and Consumption Table," Washington, DC. (Additional resources:<br />
www.bts.gov, www.faa.gov)<br />
aData are <strong>for</strong> all U.S. air carriers reporting on Form 41.<br />
bScheduled services of domestic operations only. The average passenger trip length <strong>for</strong> international operations is more than three and a half times longer than <strong>for</strong> domestic operations.<br />
cAvailable seats per aircraft is calculated as the ratio of available seat-miles to revenue aircraft-miles.<br />
dPassenger load factor is calculated as the ratio of revenue passenger-miles to available seat-miles <strong>for</strong> scheduled and nonscheduled services.<br />
eEnergy use includes fuel purchased abroad <strong>for</strong> international flights.<br />
fScheduled services only.<br />
gData are not available.<br />
12–2


