

Report
Report
Report

Create successful ePaper yourself
Turn your PDF publications into a flip-book with our unique Google optimized e-Paper software.
10 QUANTIFICATION OF BENEFITS FROM ECONOMIC COOPERATION IN SOUTH ASIA<br />
countries. However, this trend was reversed over the<br />
20-year period. The share of agriculture in GDP<br />
decelerated to 7.7% in Nepal, the lowest as compared<br />
to other South Asian countries, however, the contribution<br />
of the manufacturing sector was the highest in this<br />
country. The share of agriculture decelerated in almost<br />
all the economies. While, the manufacturing sector<br />
maintained its share of less than 20% (with Nepal being<br />
an exception). This is indicative of the relatively rapid<br />
expansion of the service sector in almost all the<br />
economies (the exception being Nepal). With respect<br />
to the trade openness, Maldives has remained a<br />
relatively open economy, followed by Sri Lanka and<br />
Bhutan. The share of exports and imports to GDP was<br />
the highest in Maldives in the 1980s and 1990s, while<br />
the share remained low in Bangladesh and India. The<br />
share of imports and exports in GDP has increased in<br />
almost all the South Asian economies over the 20-year<br />
period starting from 1986, reflecting a transition<br />
towards a more open and liberalised economy.<br />
We now examine in greater detail the country-wise<br />
economic and trade profiles.<br />
Bangladesh<br />
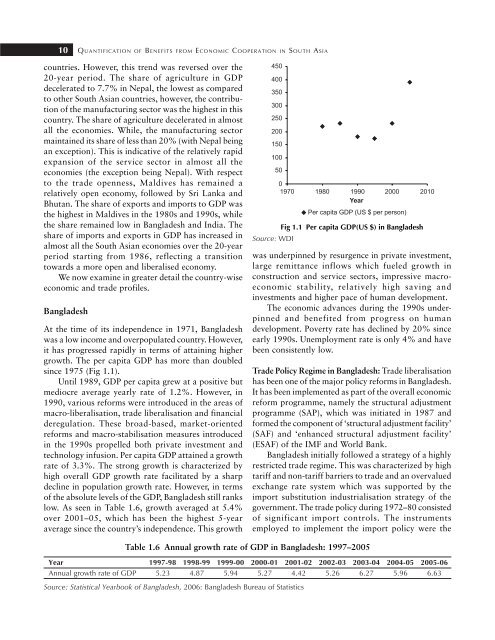
At the time of its independence in 1971, Bangladesh<br />
was a low income and overpopulated country. However,<br />
it has progressed rapidly in terms of attaining higher<br />
growth. The per capita GDP has more than doubled<br />
since 1975 (Fig 1.1).<br />
Until 1989, GDP per capita grew at a positive but<br />
mediocre average yearly rate of 1.2%. However, in<br />
1990, various reforms were introduced in the areas of<br />
macro-liberalisation, trade liberalisation and financial<br />
deregulation. These broad-based, market-oriented<br />
reforms and macro-stabilisation measures introduced<br />
in the 1990s propelled both private investment and<br />
technology infusion. Per capita GDP attained a growth<br />
rate of 3.3%. The strong growth is characterized by<br />
high overall GDP growth rate facilitated by a sharp<br />
decline in population growth rate. However, in terms<br />
of the absolute levels of the GDP, Bangladesh still ranks<br />
low. As seen in Table 1.6, growth averaged at 5.4%<br />
over 2001–05, which has been the highest 5-year<br />
average since the country’s independence. This growth<br />
Fig 1.1 Per capita GDP(US $) in Bangladesh<br />
Source: WDI<br />
was underpinned by resurgence in private investment,<br />
large remittance inflows which fueled growth in<br />
construction and service sectors, impressive macroeconomic<br />
stability, relatively high saving and<br />
investments and higher pace of human development.<br />
The economic advances during the 1990s underpinned<br />
and benefited from progress on human<br />
development. Poverty rate has declined by 20% since<br />
early 1990s. Unemployment rate is only 4% and have<br />
been consistently low.<br />
Trade Policy Regime in Bangladesh: Trade liberalisation<br />
has been one of the major policy reforms in Bangladesh.<br />
It has been implemented as part of the overall economic<br />
reform programme, namely the structural adjustment<br />
programme (SAP), which was initiated in 1987 and<br />
formed the component of ‘structural adjustment facility’<br />
(SAF) and ‘enhanced structural adjustment facility’<br />
(ESAF) of the IMF and World Bank.<br />
Bangladesh initially followed a strategy of a highly<br />
restricted trade regime. This was characterized by high<br />
tariff and non-tariff barriers to trade and an overvalued<br />
exchange rate system which was supported by the<br />
import substitution industrialisation strategy of the<br />
government. The trade policy during 1972–80 consisted<br />
of significant import controls. The instruments<br />
employed to implement the import policy were the<br />
Table 1.6 Annual growth rate of GDP in Bangladesh: 1997–2005<br />
Year 1997-98 1998-99 1999-00 2000-01 2001-02 2002-03 2003-04 2004-05 2005-06<br />
Annual growth rate of GDP 5.23 4.87 5.94 5.27 4.42 5.26 6.27 5.96 6.63<br />
Source: Statistical Yearbook of Bangladesh, 2006: Bangladesh Bureau of Statistics


