

Report
Report
Report

You also want an ePaper? Increase the reach of your titles
YUMPU automatically turns print PDFs into web optimized ePapers that Google loves.
COMPETITIVENESS AND COMPLEMENTARITIES 31<br />
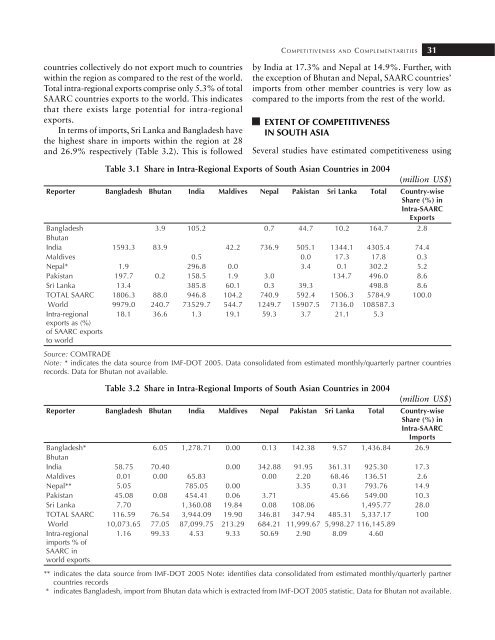
countries collectively do not export much to countries<br />
within the region as compared to the rest of the world.<br />
Total intra-regional exports comprise only 5.3% of total<br />
SAARC countries exports to the world. This indicates<br />
that there exists large potential for intra-regional<br />
exports.<br />
In terms of imports, Sri Lanka and Bangladesh have<br />
the highest share in imports within the region at 28<br />
and 26.9% respectively (Table 3.2). This is followed<br />
by India at 17.3% and Nepal at 14.9%. Further, with<br />
the exception of Bhutan and Nepal, SAARC countries’<br />
imports from other member countries is very low as<br />
compared to the imports from the rest of the world.<br />
EXTENT OF COMPETITIVENESS<br />
IN SOUTH ASIA<br />
Several studies have estimated competitiveness using<br />
Table 3.1 Share in Intra-Regional Exports of South Asian Countries in 2004<br />
(million US$)<br />
<strong>Report</strong>er Bangladesh Bhutan India Maldives Nepal Pakistan Sri Lanka Total Country-wise<br />
Share (%) in<br />
Intra-SAARC<br />
Exports<br />
Bangladesh 3.9 105.2 0.7 44.7 10.2 164.7 2.8<br />
Bhutan<br />
India 1593.3 83.9 42.2 736.9 505.1 1344.1 4305.4 74.4<br />
Maldives 0.5 0.0 17.3 17.8 0.3<br />
Nepal* 1.9 296.8 0.0 3.4 0.1 302.2 5.2<br />
Pakistan 197.7 0.2 158.5 1.9 3.0 134.7 496.0 8.6<br />
Sri Lanka 13.4 385.8 60.1 0.3 39.3 498.8 8.6<br />
TOTAL SAARC 1806.3 88.0 946.8 104.2 740.9 592.4 1506.3 5784.9 100.0<br />
World 9979.0 240.7 73529.7 544.7 1249.7 15907.5 7136.0 108587.3<br />
Intra-regional 18.1 36.6 1.3 19.1 59.3 3.7 21.1 5.3<br />
exports as (%)<br />
of SAARC exports<br />
to world<br />
Source: COMTRADE<br />
Note: * indicates the data source from IMF-DOT 2005. Data consolidated from estimated monthly/quarterly partner countries<br />
records. Data for Bhutan not available.<br />
Table 3.2 Share in Intra-Regional Imports of South Asian Countries in 2004<br />
(million US$)<br />
<strong>Report</strong>er Bangladesh Bhutan India Maldives Nepal Pakistan Sri Lanka Total Country-wise<br />
Share (%) in<br />
Intra-SAARC<br />
Imports<br />
Bangladesh* 6.05 1,278.71 0.00 0.13 142.38 9.57 1,436.84 26.9<br />
Bhutan<br />
India 58.75 70.40 0.00 342.88 91.95 361.31 925.30 17.3<br />
Maldives 0.01 0.00 65.83 0.00 2.20 68.46 136.51 2.6<br />
Nepal** 5.05 785.05 0.00 3.35 0.31 793.76 14.9<br />
Pakistan 45.08 0.08 454.41 0.06 3.71 45.66 549.00 10.3<br />
Sri Lanka 7.70 1,360.08 19.84 0.08 108.06 1,495.77 28.0<br />
TOTAL SAARC 116.59 76.54 3,944.09 19.90 346.81 347.94 485.31 5,337.17 100<br />
World 10,073.65 77.05 87,099.75 213.29 684.21 11,999.67 5,998.27 116,145.89<br />
Intra-regional 1.16 99.33 4.53 9.33 50.69 2.90 8.09 4.60<br />
imports % of<br />
SAARC in<br />
world exports<br />
** indicates the data source from IMF-DOT 2005 Note: identifies data consolidated from estimated monthly/quarterly partner<br />
countries records<br />
* indicates Bangladesh, import from Bhutan data which is extracted from IMF-DOT 2005 statistic. Data for Bhutan not available.


