

Report
Report
Report

Create successful ePaper yourself
Turn your PDF publications into a flip-book with our unique Google optimized e-Paper software.
20 QUANTIFICATION OF BENEFITS FROM ECONOMIC COOPERATION IN SOUTH ASIA<br />
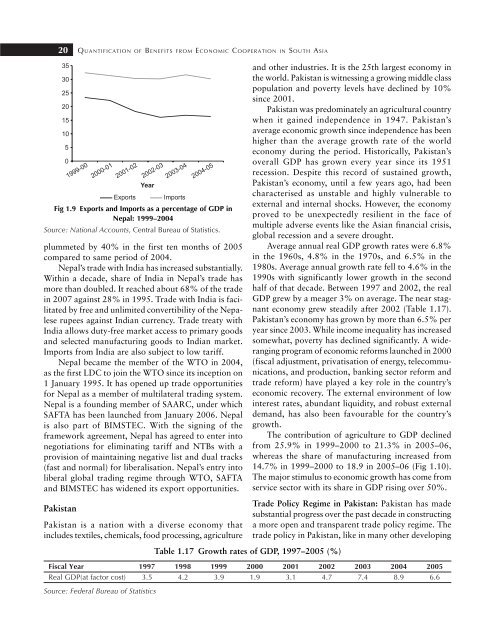
Fig 1.9 Exports and Imports as a percentage of GDP in<br />
Nepal: 1999–2004<br />
Source: National Accounts, Central Bureau of Statistics.<br />
plummeted by 40% in the first ten months of 2005<br />
compared to same period of 2004.<br />
Nepal’s trade with India has increased substantially.<br />
Within a decade, share of India in Nepal’s trade has<br />
more than doubled. It reached about 68% of the trade<br />
in 2007 against 28% in 1995. Trade with India is facilitated<br />
by free and unlimited convertibility of the Nepalese<br />
rupees against Indian currency. Trade treaty with<br />
India allows duty-free market access to primary goods<br />
and selected manufacturing goods to Indian market.<br />
Imports from India are also subject to low tariff.<br />
Nepal became the member of the WTO in 2004,<br />
as the first LDC to join the WTO since its inception on<br />
1 January 1995. It has opened up trade opportunities<br />
for Nepal as a member of multilateral trading system.<br />
Nepal is a founding member of SAARC, under which<br />
SAFTA has been launched from January 2006. Nepal<br />
is also part of BIMSTEC. With the signing of the<br />
framework agreement, Nepal has agreed to enter into<br />
negotiations for eliminating tariff and NTBs with a<br />
provision of maintaining negative list and dual tracks<br />
(fast and normal) for liberalisation. Nepal’s entry into<br />
liberal global trading regime through WTO, SAFTA<br />
and BIMSTEC has widened its export opportunities.<br />
Pakistan<br />
Pakistan is a nation with a diverse economy that<br />
includes textiles, chemicals, food processing, agriculture<br />
and other industries. It is the 25th largest economy in<br />
the world. Pakistan is witnessing a growing middle class<br />
population and poverty levels have declined by 10%<br />
since 2001.<br />
Pakistan was predominately an agricultural country<br />
when it gained independence in 1947. Pakistan’s<br />
average economic growth since independence has been<br />
higher than the average growth rate of the world<br />
economy during the period. Historically, Pakistan’s<br />
overall GDP has grown every year since its 1951<br />
recession. Despite this record of sustained growth,<br />
Pakistan’s economy, until a few years ago, had been<br />
characterised as unstable and highly vulnerable to<br />
external and internal shocks. However, the economy<br />
proved to be unexpectedly resilient in the face of<br />
multiple adverse events like the Asian financial crisis,<br />
global recession and a severe drought.<br />
Average annual real GDP growth rates were 6.8%<br />
in the 1960s, 4.8% in the 1970s, and 6.5% in the<br />
1980s. Average annual growth rate fell to 4.6% in the<br />
1990s with significantly lower growth in the second<br />
half of that decade. Between 1997 and 2002, the real<br />
GDP grew by a meager 3% on average. The near stagnant<br />
economy grew steadily after 2002 (Table 1.17).<br />
Pakistan’s economy has grown by more than 6.5% per<br />
year since 2003. While income inequality has increased<br />
somewhat, poverty has declined significantly. A wideranging<br />
program of economic reforms launched in 2000<br />
(fiscal adjustment, privatisation of energy, telecommunications,<br />
and production, banking sector reform and<br />
trade reform) have played a key role in the country’s<br />
economic recovery. The external environment of low<br />
interest rates, abundant liquidity, and robust external<br />
demand, has also been favourable for the country’s<br />
growth.<br />
The contribution of agriculture to GDP declined<br />
from 25.9% in 1999–2000 to 21.3% in 2005–06,<br />
whereas the share of manufacturing increased from<br />
14.7% in 1999–2000 to 18.9 in 2005–06 (Fig 1.10).<br />
The major stimulus to economic growth has come from<br />
service sector with its share in GDP rising over 50%.<br />
Trade Policy Regime in Pakistan: Pakistan has made<br />
substantial progress over the past decade in constructing<br />
a more open and transparent trade policy regime. The<br />
trade policy in Pakistan, like in many other developing<br />
Table 1.17 Growth rates of GDP, 1997–2005 (%)<br />
Fiscal Year 1997 1998 1999 2000 2001 2002 2003 2004 2005<br />
Real GDP(at factor cost) 3.5 4.2 3.9 1.9 3.1 4.7 7.4 8.9 6.6<br />
Source: Federal Bureau of Statistics


