

Report
Report
Report

Create successful ePaper yourself
Turn your PDF publications into a flip-book with our unique Google optimized e-Paper software.
16 QUANTIFICATION OF BENEFITS FROM ECONOMIC COOPERATION IN SOUTH ASIA<br />
maintained one of the most restrictive trade regimes in<br />
the world. It imposed a system of high tariffs and stiff<br />
NTBs such as licensing and quotas, which virtually<br />
closed the economy from the international trade arena.<br />
Far from viewing foreign trade as an engine of economic<br />
growth, Indian planners sought to minimize import<br />
demand and viewed exports mainly to generate the<br />
foreign exchange earnings to meet that part of the<br />
import bill not covered by external assistance. They<br />
created an elaborate administrative regulatory<br />
machinery to control both imports and exports. As a<br />
consequence, both exports and imports as a percentage<br />
of GDP declined. The 1980s can be viewed as a period<br />
of growing uneasiness with the policies of excessive<br />
protectionism. The import needs became stronger as<br />
the industrial growth showed an accelerating<br />
trend. Also, it was realised after the first oil shock<br />
of 1973 that India had to step up exports to finance<br />
the rising import bill on account of an increase in oil<br />
prices.<br />
The 1980s is marked by a clear shift in the trade<br />
strategy towards reduction of quantitative restrictions<br />
on imports. Exports and imports as per cent of GDP<br />
showed an upward trend in 1980s. While the signs of<br />
liberalised trade policy became visible in the latter half<br />
of the decade, it was only in 1991 that the country<br />
embarked on a truly liberalised trade policy with a short<br />
negative list of exports and imports and with quantitative<br />
controls over imports withdrawn for all, except<br />
consumer goods. The reforms included liberalisation<br />
of import licensing, reduction in tariffs, abolition of<br />
cash subsidies for exports, devaluation of the rupee,<br />
introduction of partial convertibility of the rupee on<br />
the current account and later full convertibility of the<br />
rupee on the current account. As a result exports as a<br />
per cent of GDP rose from over 6% level to over 8% in<br />
1990s (Table 1.11). The export momentum slowed<br />
down since 1996–97 due to both global and domestic<br />
factors, however, it again picked up in 2001–02. There<br />
was a significant increase in the share of imports<br />
alongside except for 1991–92 due to the severe import<br />
curbs introduced after the payment crisis of 1991–92.<br />
It can be safely asserted that India’s trade has been<br />
open now compared to that of the pre-reform period,<br />
as the trade to GDP increased from 14.4% in 1980 to<br />
22.8% in 2000. However, when it comes to an international<br />
comparison, India’s trade to GDP ratio is low.<br />
For example, in the People’s Republic of China, share<br />
of trade rose from 12.6% in 1980 to 37% in 1999.<br />
India is an active member of WTO. Although India<br />
has been a strong supporter of multilateral<br />
liberalisation, it has also sought out RTAs in recent<br />
years. Since signing the Bangkok Agreement in 1975,<br />
India has signed trade agreements mainly with other<br />
developing countries such as the global system of trade<br />
preferences (GSTP), SAFTA, and an FTA with Sri<br />
Lanka. India has also signed a comprehensive economic<br />
cooperation agreement (CECA) with ASEAN,<br />
European Union, Japan and Korea.<br />
The Maldives<br />
Maldives is a small island developing nation in the<br />
Indian Ocean. Since its independence in 1965, the<br />
Maldives has achieved commendable economic development.<br />
While the country was one of the poorest in South<br />
Asia in the early 1970s, it now has the highest per<br />
capita income in the region. Maldives per capita GDP<br />
rose from US $266 in 1980 to US $995 in 1990, the<br />
highest as compared to other South Asian economies.<br />
It recorded the per capita GDP of US $2328 in 2005.<br />
The country’s economy is dependent on fishing,<br />
tourism and foreign imports. Tourism is the largest<br />
industry in Maldives, accounting for 20% of GDP and<br />
more than 60% of foreign exchange receipt. It powered<br />
current GDP per capita to expand 265% in the 1980s<br />
and a further 115% in 1990s. Fishing is the second<br />
leading sector in Maldives. While the contribution of<br />
fisheries has been declining over time, it remains vital<br />
to the economy, because it is the main provider of food<br />
items and employment in a number of atolls.<br />
Agriculture and manufacturing play a minor role in<br />
the economy, constrained by the limited availability of<br />
cultivable land and shortage of domestic labor. Most<br />
staple foods are imported.<br />
During 1996–98, the Maldives’ economy grew by<br />
8–9% as a result of favourable development in<br />
transportation, communication, utilities, tourism,<br />
fisheries, and manufacturing, particularly garments. In<br />
1999, growth was estimated at 8.5% (Table 1.12). This<br />
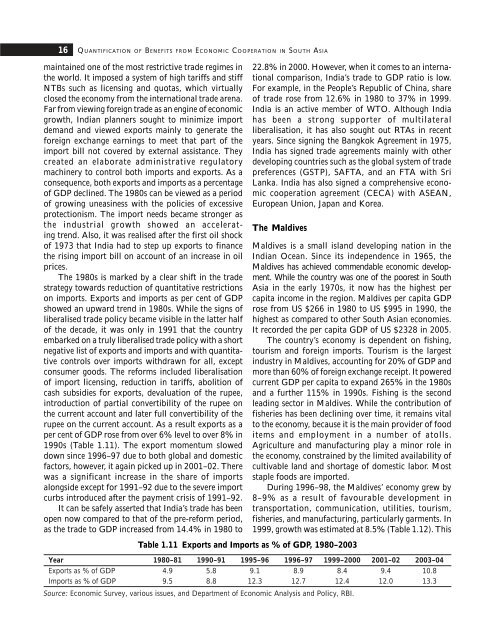
Table 1.11 Exports and Imports as % of GDP, 1980–2003<br />
Year 1980–81 1990–91 1995–96 1996–97 1999–2000 2001–02 2003–04<br />
Exports as % of GDP 4.9 5.8 9.1 8.9 8.4 9.4 10.8<br />
Imports as % of GDP 9.5 8.8 12.3 12.7 12.4 12.0 13.3<br />
Source: Economic Survey, various issues, and Department of Economic Analysis and Policy, RBI.


