

Report
Report
Report

Create successful ePaper yourself
Turn your PDF publications into a flip-book with our unique Google optimized e-Paper software.
I NTRODUCTION 15<br />
The period from 1992–93 and 1993–94 was the<br />
period of recovery from the crisis while the period from<br />
1994–95 to 1996–97 was marked by the high growth<br />
of economy (Table 1.10). The growth rate of GDP<br />
averaged as much as 7.5% per annum in the latter,<br />
higher from 5.5% in the former. This was the only<br />
period in India’s economic history during which real<br />
GDP growth exceeded 7% consecutively over a period<br />
of three years. The sharp acceleration in the rate of<br />
growth of overall GDP was the result of phenomenal<br />
growth of 10.8% per annum in the industrial sector.<br />
Table 1.10 Growth rate of GDP at Factor Cost at<br />
constant prices in India, 1992–2006 (%)<br />
Year<br />
Growth Rate of GDP at Factor Cost<br />
1992–93 5.1<br />
1993–94 5.9<br />
1994–95 7.3<br />
1995–96 7.3<br />
1996–97 7.8<br />
1997–98 4.8<br />
1998–99 6.5<br />
1999–00 6.1<br />
2000–01 4.4<br />
2001–02 5.6<br />
2002–03 4.3<br />
2003–04 8.5<br />
2004–05 6.9<br />
2005–06 9.0<br />
2006–07 9.2<br />
Source: Economic Suvey, various issues.<br />
The phase from 1997–98 to 2002–03 was marked<br />
by a general deceleration in growth with the average<br />
rate of growth during this period turning out to be<br />
5.3%., which was much lower than the average growth<br />
of 7.5% per annum recorded during the period of high<br />
growth from 1994–95 to 1996–97. The reason is<br />
attributed to the steep decline in industrial growth, led<br />
by a severe slowdown in the manufacturing sector.<br />
Within this second phase, real GDP growth, after<br />
dipping to 4.8% in 1997–98, recovered during the years<br />
1998–99 and 1999–2000 to over 6%. One of the<br />
factors contributing to this recovery was the high<br />
growth emanating from service sector, and within the<br />
service sector, the growth of ‘community, social and<br />
personal services’, particularly ‘public administration<br />
and defence’ in 1997–98, with its lagged effect persisting<br />
till 1999–2000. In 2000–01, growth of overall GDP<br />
dipped to 4.4%. This was a result of poor performance<br />
of agriculture, coupled with significant deceleration in<br />
the growth rate of GDP from the service sector,<br />
particularly ‘finance, insurance, real estate and business<br />
services’. In 2002–03, the rate of growth registered was<br />
again 4.3% as compared to 5.8% in 2001–02, which<br />
has been an outcome of a sharp fall in agricultural<br />
growth to a negative of 3.1% owing to the drought<br />
conditions.<br />
Buoyed by a rebound in agriculture sector, and<br />
strongly helped by improved performance in industry<br />
and services, the economy registered a growth rate of<br />
8.5% in 2003–04. In spite of a deficient south-west<br />
monsoon, hardening international prices of oil and steel<br />
and extensive damage of life and property caused by<br />
tsunami, the economy managed to maintain the growth<br />
momentum, with the growth recorded at 6.9% in<br />
2004–05. The growth of 9% and 9.2% in 2005–06<br />
and 2006–07, respectively surpassed expectations.<br />
While the uneven pattern in agriculture continued with<br />
growth estimated at 6% and 2.7% in the two recent<br />
years, services maintained its vigorous growth performance.<br />
There were distinct signs of sustained improvements<br />
on the industrial front.<br />
The economy has moved decisively to a higher<br />
growth phase, with the growth in GDP exceeding 8%<br />
each year since 2003–04. The projected economic<br />
growth of 8.7% for 2008–09 is in line with this trend.<br />
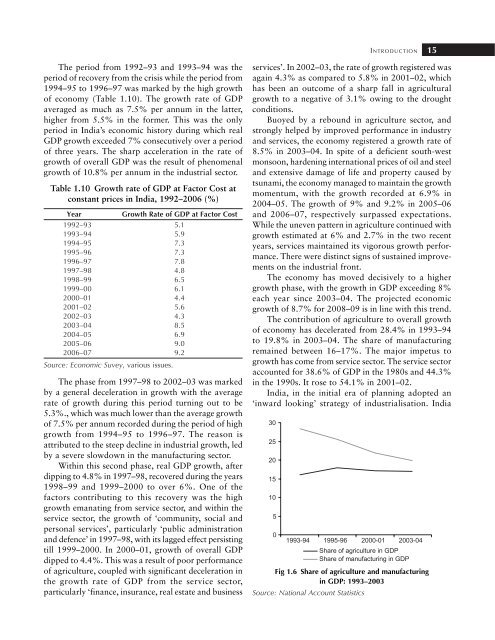
The contribution of agriculture to overall growth<br />
of economy has decelerated from 28.4% in 1993–94<br />
to 19.8% in 2003–04. The share of manufacturing<br />
remained between 16–17%. The major impetus to<br />
growth has come from service sector. The service sector<br />
accounted for 38.6% of GDP in the 1980s and 44.3%<br />
in the 1990s. It rose to 54.1% in 2001–02.<br />
India, in the initial era of planning adopted an<br />
‘inward looking’ strategy of industrialisation. India<br />
Fig 1.6 Share of agriculture and manufacturing<br />
in GDP: 1993–2003<br />
Source: National Account Statistics


