

Report
Report
Report

Create successful ePaper yourself
Turn your PDF publications into a flip-book with our unique Google optimized e-Paper software.
64 QUANTIFICATION OF BENEFITS FROM ECONOMIC COOPERATION IN SOUTH ASIA<br />
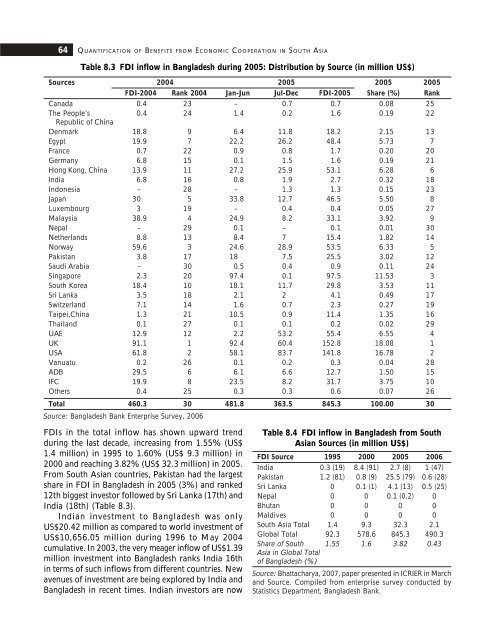
Table 8.3 FDI inflow in Bangladesh during 2005: Distribution by Source (in million US$)<br />
Sources 2004 2005 2005 2005<br />
FDI-2004 Rank 2004 Jan-Jun Jul-Dec FDI-2005 Share (%) Rank<br />
Canada 0.4 23 – 0.7 0.7 0.08 25<br />
The People’s 0.4 24 1.4 0.2 1.6 0.19 22<br />
Republic of China<br />
Denmark 18.8 9 6.4 11.8 18.2 2.15 13<br />
Egypt 19.9 7 22.2 26.2 48.4 5.73 7<br />
France 0.7 22 0.9 0.8 1.7 0.20 20<br />
Germany 6.8 15 0.1 1.5 1.6 0.19 21<br />
Hong Kong, China 13.9 11 27.2 25.9 53.1 6.28 6<br />
India 6.8 16 0.8 1.9 2.7 0.32 18<br />
Indonesia – 28 – 1.3 1.3 0.15 23<br />
Japan 30 5 33.8 12.7 46.5 5.50 8<br />
Luxembourg 3 19 – 0.4 0.4 0.05 27<br />
Malaysia 38.9 4 24.9 8.2 33.1 3.92 9<br />
Nepal – 29 0.1 – 0.1 0.01 30<br />
Netherlands 8.8 13 8.4 7 15.4 1.82 14<br />
Norway 59.6 3 24.6 28.9 53.5 6.33 5<br />
Pakistan 3.8 17 18 7.5 25.5 3.02 12<br />
Saudi Arabia – 30 0.5 0.4 0.9 0.11 24<br />
Singapore 2.3 20 97.4 0.1 97.5 11.53 3<br />
South Korea 18.4 10 18.1 11.7 29.8 3.53 11<br />
Sri Lanka 3.5 18 2.1 2 4.1 0.49 17<br />
Switzerland 7.1 14 1.6 0.7 2.3 0.27 19<br />
Taipei,China 1.3 21 10.5 0.9 11.4 1.35 16<br />
Thailand 0.1 27 0.1 0.1 0.2 0.02 29<br />
UAE 12.9 12 2.2 53.2 55.4 6.55 4<br />
UK 91.1 1 92.4 60.4 152.8 18.08 1<br />
USA 61.8 2 58.1 83.7 141.8 16.78 2<br />
Vanuatu 0.2 26 0.1 0.2 0.3 0.04 28<br />
ADB 29.5 6 6.1 6.6 12.7 1.50 15<br />
IFC 19.9 8 23.5 8.2 31.7 3.75 10<br />
Others 0.4 25 0.3 0.3 0.6 0.07 26<br />
Total 460.3 30 481.8 363.5 845.3 100.00 30<br />
Source: Bangladesh Bank Enterprise Survey, 2006<br />
FDIs in the total inflow has shown upward trend<br />
during the last decade, increasing from 1.55% (US$<br />
1.4 million) in 1995 to 1.60% (US$ 9.3 million) in<br />
2000 and reaching 3.82% (US$ 32.3 million) in 2005.<br />
From South Asian countries, Pakistan had the largest<br />
share in FDI in Bangladesh in 2005 (3%) and ranked<br />
12th biggest investor followed by Sri Lanka (17th) and<br />
India (18th) (Table 8.3).<br />
Indian investment to Bangladesh was only<br />
US$20.42 million as compared to world investment of<br />
US$10,656.05 million during 1996 to May 2004<br />
cumulative. In 2003, the very meager inflow of US$1.39<br />
million investment into Bangladesh ranks India 16th<br />
in terms of such inflows from different countries. New<br />
avenues of investment are being explored by India and<br />
Bangladesh in recent times. Indian investors are now<br />
Table 8.4 FDI inflow in Bangladesh from South<br />
Asian Sources (in million US$)<br />
FDI Source 1995 2000 2005 2006<br />
India 0.3 (19) 8.4 (91) 2.7 (8) 1 (47)<br />
Pakistan 1.2 (81) 0.8 (9) 25.5 (79) 0.6 (28)<br />
Sri Lanka 0 0.1 (1) 4.1 (13) 0.5 (25)<br />
Nepal 0 0 0.1 (0.2) 0<br />
Bhutan 0 0 0 0<br />
Maldives 0 0 0 0<br />
South Asia Total 1.4 9.3 32.3 2.1<br />
Global Total 92.3 578.6 845.3 490.3<br />
Share of South 1.55 1.6 3.82 0.43<br />
Asia in Global Total<br />
of Bangladesh (%)<br />
Source: Bhattacharya, 2007, paper presented in ICRIER in March<br />
and Source. Compiled from enterprise survey conducted by<br />
Statistics Department, Bangladesh Bank.


