

Report
Report
Report

Create successful ePaper yourself
Turn your PDF publications into a flip-book with our unique Google optimized e-Paper software.
40 QUANTIFICATION OF BENEFITS FROM ECONOMIC COOPERATION IN SOUTH ASIA<br />
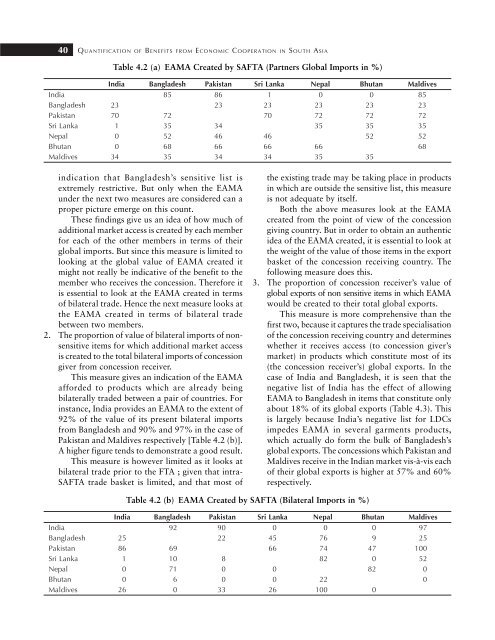
Table 4.2 (a) EAMA Created by SAFTA (Partners Global Imports in %)<br />
India Bangladesh Pakistan Sri Lanka Nepal Bhutan Maldives<br />
India 85 86 1 0 0 85<br />
Bangladesh 23 23 23 23 23 23<br />
Pakistan 70 72 70 72 72 72<br />
Sri Lanka 1 35 34 35 35 35<br />
Nepal 0 52 46 46 52 52<br />
Bhutan 0 68 66 66 66 68<br />
Maldives 34 35 34 34 35 35<br />
indication that Bangladesh’s sensitive list is<br />
extremely restrictive. But only when the EAMA<br />
under the next two measures are considered can a<br />
proper picture emerge on this count.<br />
These findings give us an idea of how much of<br />
additional market access is created by each member<br />
for each of the other members in terms of their<br />
global imports. But since this measure is limited to<br />
looking at the global value of EAMA created it<br />
might not really be indicative of the benefit to the<br />
member who receives the concession. Therefore it<br />
is essential to look at the EAMA created in terms<br />
of bilateral trade. Hence the next measure looks at<br />
the EAMA created in terms of bilateral trade<br />
between two members.<br />
2. The proportion of value of bilateral imports of nonsensitive<br />
items for which additional market access<br />
is created to the total bilateral imports of concession<br />
giver from concession receiver.<br />
This measure gives an indication of the EAMA<br />
afforded to products which are already being<br />
bilaterally traded between a pair of countries. For<br />
instance, India provides an EAMA to the extent of<br />
92% of the value of its present bilateral imports<br />
from Bangladesh and 90% and 97% in the case of<br />
Pakistan and Maldives respectively [Table 4.2 (b)].<br />
A higher figure tends to demonstrate a good result.<br />
This measure is however limited as it looks at<br />
bilateral trade prior to the FTA ; given that intra-<br />
SAFTA trade basket is limited, and that most of<br />
the existing trade may be taking place in products<br />
in which are outside the sensitive list, this measure<br />
is not adequate by itself.<br />
Both the above measures look at the EAMA<br />
created from the point of view of the concession<br />
giving country. But in order to obtain an authentic<br />
idea of the EAMA created, it is essential to look at<br />
the weight of the value of those items in the export<br />
basket of the concession receiving country. The<br />
following measure does this.<br />
3. The proportion of concession receiver’s value of<br />
global exports of non sensitive items in which EAMA<br />
would be created to their total global exports.<br />
This measure is more comprehensive than the<br />
first two, because it captures the trade specialisation<br />
of the concession receiving country and determines<br />
whether it receives access (to concession giver’s<br />
market) in products which constitute most of its<br />
(the concession receiver’s) global exports. In the<br />
case of India and Bangladesh, it is seen that the<br />
negative list of India has the effect of allowing<br />
EAMA to Bangladesh in items that constitute only<br />
about 18% of its global exports (Table 4.3). This<br />
is largely because India’s negative list for LDCs<br />
impedes EAMA in several garments products,<br />
which actually do form the bulk of Bangladesh’s<br />
global exports. The concessions which Pakistan and<br />
Maldives receive in the Indian market vis-à-vis each<br />
of their global exports is higher at 57% and 60%<br />
respectively.<br />
Table 4.2 (b) EAMA Created by SAFTA (Bilateral Imports in %)<br />
India Bangladesh Pakistan Sri Lanka Nepal Bhutan Maldives<br />
India 92 90 0 0 0 97<br />
Bangladesh 25 22 45 76 9 25<br />
Pakistan 86 69 66 74 47 100<br />
Sri Lanka 1 10 8 82 0 52<br />
Nepal 0 71 0 0 82 0<br />
Bhutan 0 6 0 0 22 0<br />
Maldives 26 0 33 26 100 0


