

Report
Report
Report

Create successful ePaper yourself
Turn your PDF publications into a flip-book with our unique Google optimized e-Paper software.
QUANTIFICATION OF BENEFITS FROM TRANSPORT AND TRADE FACILITATION IN SOUTH ASIA 73<br />
important role in facilitating informal trade at the<br />
border. However, while informal trade may have<br />
initially been confined within short distances and<br />
neighbourhood communities, it has expanded and<br />
enveloped the entire region.<br />
Taneja (2004 and 2005) has intensively worked on<br />
informal trade in the region and has analysed the<br />
magnitude and features of informal trade between<br />
countries. The main finding is that total informal trade<br />
in South Asia is US $1.5 billion, which is 72% of formal<br />
trade (for the years for which data are available). Some<br />
survey results even put the magnitude of informal trade<br />
at more than 100% of official trade, as in the case of<br />
Bangladesh exports to India (Bakht and Sen 2002).<br />
India’s Geographic Position<br />
India is the central actor in South Asia’s informal trade<br />
as it is the only country that shares borders with almost<br />
all the countries and the other countries do not share<br />
borders with each other except India. India is also a<br />
dominant and key player in the region due to its size,<br />
geographic location, and economic performance. India’s<br />
recent high growth can now be shared by the countries<br />
of the subregion. The analysis herein therefore takes<br />
on an Indo-centric approach to demonstrate the gains<br />
from transport and trade facilitation.<br />
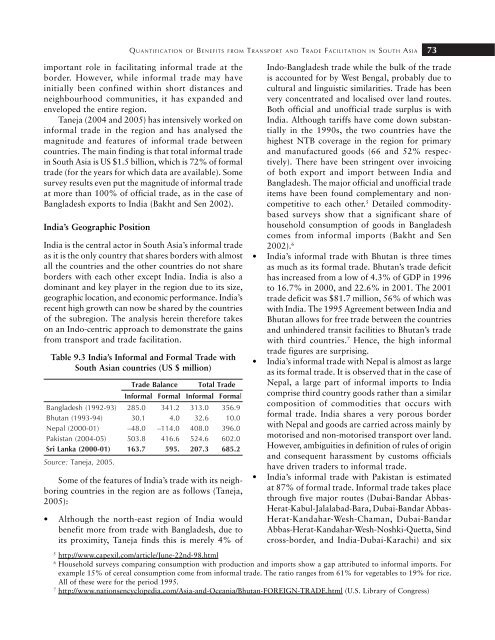
Table 9.3 India’s Informal and Formal Trade with<br />
South Asian countries (US $ million)<br />
Trade Balance Total Trade<br />
Informal Formal Informal Formal<br />
Bangladesh (1992-93) 285.0 341.2 313.0 356.9<br />
Bhutan (1993-94) 30.1 4.0 32.6 10.0<br />
Nepal (2000-01) –48.0 –114.0 408.0 396.0<br />
Pakistan (2004-05) 503.8 416.6 524.6 602.0<br />
Sri Lanka (2000-01) 163.7 595. 207.3 685.2<br />
Source: Taneja, 2005.<br />
Some of the features of India’s trade with its neighboring<br />
countries in the region are as follows (Taneja,<br />
2005):<br />
• Although the north-east region of India would<br />
benefit more from trade with Bangladesh, due to<br />
its proximity, Taneja finds this is merely 4% of<br />
Indo-Bangladesh trade while the bulk of the trade<br />
is accounted for by West Bengal, probably due to<br />
cultural and linguistic similarities. Trade has been<br />
very concentrated and localised over land routes.<br />
Both official and unofficial trade surplus is with<br />
India. Although tariffs have come down substantially<br />
in the 1990s, the two countries have the<br />
highest NTB coverage in the region for primary<br />
and manufactured goods (66 and 52% respectively).<br />
There have been stringent over invoicing<br />
of both export and import between India and<br />
Bangladesh. The major official and unofficial trade<br />
items have been found complementary and noncompetitive<br />
to each other. 5 Detailed commoditybased<br />
surveys show that a significant share of<br />
household consumption of goods in Bangladesh<br />
comes from informal imports (Bakht and Sen<br />
2002). 6<br />
• India’s informal trade with Bhutan is three times<br />
as much as its formal trade. Bhutan’s trade deficit<br />
has increased from a low of 4.3% of GDP in 1996<br />
to 16.7% in 2000, and 22.6% in 2001. The 2001<br />
trade deficit was $81.7 million, 56% of which was<br />
with India. The 1995 Agreement between India and<br />
Bhutan allows for free trade between the countries<br />
and unhindered transit facilities to Bhutan’s trade<br />
with third countries. 7 Hence, the high informal<br />
trade figures are surprising.<br />
• India’s informal trade with Nepal is almost as large<br />
as its formal trade. It is observed that in the case of<br />
Nepal, a large part of informal imports to India<br />
comprise third country goods rather than a similar<br />
composition of commodities that occurs with<br />
formal trade. India shares a very porous border<br />
with Nepal and goods are carried across mainly by<br />
motorised and non-motorised transport over land.<br />
However, ambiguities in definition of rules of origin<br />
and consequent harassment by customs officials<br />
have driven traders to informal trade.<br />
• India’s informal trade with Pakistan is estimated<br />
at 87% of formal trade. Informal trade takes place<br />
through five major routes (Dubai-Bandar Abbas-<br />
Herat-Kabul-Jalalabad-Bara, Dubai-Bandar Abbas-<br />
Herat-Kandahar-Wesh-Chaman, Dubai-Bandar<br />
Abbas-Herat-Kandahar-Wesh-Noshki-Quetta, Sind<br />
cross-border, and India-Dubai-Karachi) and six<br />
5<br />
http://www.capexil.com/article/June-22nd-98.html<br />
6<br />
Household surveys comparing consumption with production and imports show a gap attributed to informal imports. For<br />
example 15% of cereal consumption come from informal trade. The ratio ranges from 61% for vegetables to 19% for rice.<br />
All of these were for the period 1995.<br />
7<br />
http://www.nationsencyclopedia.com/Asia-and-Oceania/Bhutan-FOREIGN-TRADE.html (U.S. Library of Congress)


