46 QUANTIFICATION OF BENEFITS FROM ECONOMIC COOPERATION IN SOUTH ASIA However, common ethnic language is found to influence bilateral trade amongst the SAFTA member countries. This may imply that common cultures lead to higher trade between countries. ESTIMATES OF POTENTIAL TRADE Potential intra-regional trade under SAFTA is estimated using the coefficients (Equation 1) arrived at by the fixed effect models presented in Table 5.1. The results are presented in Table 5.2. Table 5.2 Trade Potential in SAFTA (US Bn $), 1995–2005 Potential Actual GAP (% Trade Trade of Actual Trade) Using coefficients of 85.1 38.5 120 equation 2 (without tariffs) Using coefficients of 54.0 38.5 40 equation 1 (with tariffs) For the year 2004 9.0 5.8 55 The estimates show that the potential trade among the SAFTA member countries as predicted by the gravity model is 120% more than the actual trade. A number of studies have estimated potential trade as the difference between trade predicted by the gravity model and actual trade. The entire difference between predicted and actual trade has been attributed to tariffs and it has been argued that removal of tariffs will increase trade to the predicted level. However, the entire difference between the predicted trade and actual trade may not be due to tariffs. The results show that even if tariffs are not removed the gap between potential and actual intra-regional trade exists. Increase in trade which can be directly attributed to removal of tariffs under SAFTA is 80% of the actual intra-regional trade from the predicted intra-regional trade of 120%. This implies that apart from tariffs there exist other barriers to trade. Intra-regional trade may rise by further 40% if other factors affecting trade are addressed like nontariff barriers, political constraints, etc. Table 5.3 presents potential and actual bilateral trade (taking average of the period 1995–2005) for different trading partners in SAFTA. The results show that the gap between actual and potential trade on an average for each trading partner is of around 55%. The trading partners have very little bilateral trade and can increase their trade by almost 100%. These are Bhutan and Maldives; Bhutan and Sri Lanka; Maldives Table 5.3 Bilateral Potential and Actual Trade: Average (1995–2005) Trading Partners Potential Trade (US$) Actual Trade(US$) GAP between Actual and Potential Trade (%) Bangladesh Bhutan 74,122,629 1,851,748 97.5 Bangladesh India 1,649,726,827 1,169,270,758 29.1 Bangladesh Maldives 62,313,028 33,754 99.9 Bangladesh Nepal 260,668,335 5,151,398 98.0 Bangladesh Pakistan 707,113,385 176,874,180 75.0 Bangladesh Sri Lanka 337,726,970 17,630,354 94.8 Bhutan India 203,427,095 89,076,530 56.2 Bhutan Maldives 7,757,506 794 100.0 Bhutan Nepal 31,459,064 301,755 99.0 Bhutan Pakistan 84,788,140 369,448 99.6 Bhutan Sri Lanka 39,226,671 3,192 100.0 India Maldives 172,314,889 26,263,194 84.8 India Nepal 699,049,061 571,226,702 18.3 India Pakistan 1,884,185,017 340,488,988 81.9 India Sri Lanka 871,776,252 969,255,660 –11.2 Sri Lanka Pakistan 383,773,384 127,775,924 66.7 Sri Lanka Maldives 35,445,306 59,066,225 -66.6 Sri Lanka Nepal 142,559,703 1,375,802 99.0 Maldives Nepal 27,397,294 468 100.0 Maldives Pakistan 73,840,899 1,988,579 97.3 Nepal Pakistan 299,656,776 3,955,535 98.7 Average Intra-Regional Trade 8,048,328,229 3,561,960,989 55.7
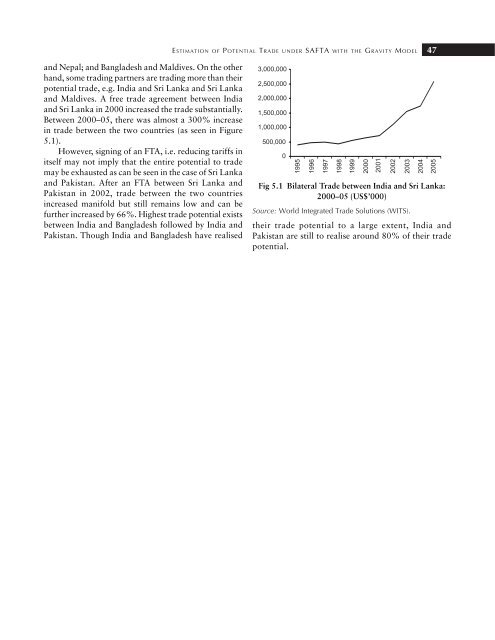
ESTIMATION OF POTENTIAL TRADE UNDER SAFTA WITH THE GRAVITY MODEL 47 and Nepal; and Bangladesh and Maldives. On the other hand, some trading partners are trading more than their potential trade, e.g. India and Sri Lanka and Sri Lanka and Maldives. A free trade agreement between India and Sri Lanka in 2000 increased the trade substantially. Between 2000–05, there was almost a 300% increase in trade between the two countries (as seen in Figure 5.1). However, signing of an FTA, i.e. reducing tariffs in itself may not imply that the entire potential to trade may be exhausted as can be seen in the case of Sri Lanka and Pakistan. After an FTA between Sri Lanka and Pakistan in 2002, trade between the two countries increased manifold but still remains low and can be further increased by 66%. Highest trade potential exists between India and Bangladesh followed by India and Pakistan. Though India and Bangladesh have realised Fig 5.1 Bilateral Trade between India and Sri Lanka: 2000–05 (US$’000) Source: World Integrated Trade Solutions (WITS). their trade potential to a large extent, India and Pakistan are still to realise around 80% of their trade potential.