

The Benefits to Taxpayers from Increases in Students - RAND ...
The Benefits to Taxpayers from Increases in Students - RAND ...
The Benefits to Taxpayers from Increases in Students - RAND ...

You also want an ePaper? Increase the reach of your titles
YUMPU automatically turns print PDFs into web optimized ePapers that Google loves.
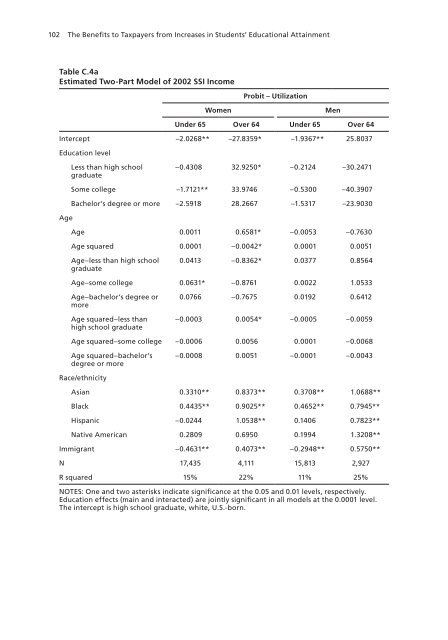
102 <strong>The</strong> <strong>Benefits</strong> <strong>to</strong> <strong>Taxpayers</strong> <strong>from</strong> <strong>Increases</strong> <strong>in</strong> <strong>Students</strong>’ Educational Atta<strong>in</strong>ment<br />
Table C.4a<br />
Estimated Two-Part Model of 2002 SSI Income<br />
Probit – Utilization<br />
Women<br />
Men<br />
Under 65 Over 64 Under 65 Over 64<br />
Intercept –2.0268** –27.8359* –1.9367** 25.8037<br />
Education level<br />
Less than high school<br />
graduate<br />
–0.4308 32.9250* –0.2124 –30.2471<br />
Some college –1.7121** 33.9746 –0.5300 –40.3907<br />
Bachelor’s degree or more –2.5918 28.2667 –1.5317 –23.9030<br />
Age<br />
Age 0.0011 0.6581* –0.0053 –0.7630<br />
Age squared 0.0001 –0.0042* 0.0001 0.0051<br />
Age–less than high school<br />
graduate<br />
0.0413 –0.8362* 0.0377 0.8564<br />
Age–some college 0.0631* –0.8761 0.0022 1.0533<br />
Age–bachelor’s degree or<br />
more<br />
Age squared–less than<br />
high school graduate<br />
0.0766 –0.7675 0.0192 0.6412<br />
–0.0003 0.0054* –0.0005 –0.0059<br />
Age squared–some college –0.0006 0.0056 0.0001 –0.0068<br />
Age squared–bachelor’s<br />
degree or more<br />
–0.0008 0.0051 –0.0001 –0.0043<br />
Race/ethnicity<br />
Asian 0.3310** 0.8373** 0.3708** 1.0688**<br />
Black 0.4435** 0.9025** 0.4652** 0.7945**<br />
Hispanic –0.0244 1.0538** 0.1406 0.7823**<br />
Native American 0.2809 0.6950 0.1994 1.3208**<br />
Immigrant –0.4631** 0.4073** –0.2948** 0.5750**<br />
N 17,435 4,111 15,813 2,927<br />
R squared 15% 22% 11% 25%<br />
NOTES: One and two asterisks <strong>in</strong>dicate significance at the 0.05 and 0.01 levels, respectively.<br />
Education effects (ma<strong>in</strong> and <strong>in</strong>teracted) are jo<strong>in</strong>tly significant <strong>in</strong> all models at the 0.0001 level.<br />
<strong>The</strong> <strong>in</strong>tercept is high school graduate, white, U.S.-born.


