

The Benefits to Taxpayers from Increases in Students - RAND ...
The Benefits to Taxpayers from Increases in Students - RAND ...
The Benefits to Taxpayers from Increases in Students - RAND ...

You also want an ePaper? Increase the reach of your titles
YUMPU automatically turns print PDFs into web optimized ePapers that Google loves.
Spend<strong>in</strong>g on Social Support Programs 59<br />
Table 4.2<br />
Range of Percentage Reduction <strong>in</strong> Social Program Spend<strong>in</strong>g If Effect<br />
of Increased Education Is Reduced 25 Percent, U.S.-Born Men and<br />
Women<br />
Increase <strong>in</strong> Education Level<br />
Less than high school graduate<br />
<strong>to</strong> high school graduate<br />
High school graduate <strong>to</strong> some<br />
college<br />
Some college <strong>to</strong> bachelor’s<br />
degree or more<br />
Less than high school graduate<br />
<strong>to</strong> bachelor’s degree or more<br />
Percentage Reduction<br />
30 (Hispanic woman) <strong>to</strong> 33 (white man)<br />
10 (white man) <strong>to</strong> 21 (black woman)<br />
12 (black man) <strong>to</strong> 20 (white man)<br />
23 (black woman) <strong>to</strong> 25 (white man)<br />
ferent demographic groups. Decreases <strong>in</strong> the estimated effects of <strong>in</strong>creases <strong>in</strong> education<br />
<strong>from</strong> high school graduate <strong>to</strong> some college and <strong>from</strong> some college <strong>to</strong> bachelor’s degree<br />
or more generally result <strong>in</strong> greater reductions <strong>in</strong> estimated <strong>to</strong>tal benefits for men and<br />
for whites.<br />
Even if we assume that the estimates of the effects of <strong>in</strong>creased educational atta<strong>in</strong>ment<br />
are overly optimistic, the results still imply that such <strong>in</strong>creases will yield significant<br />
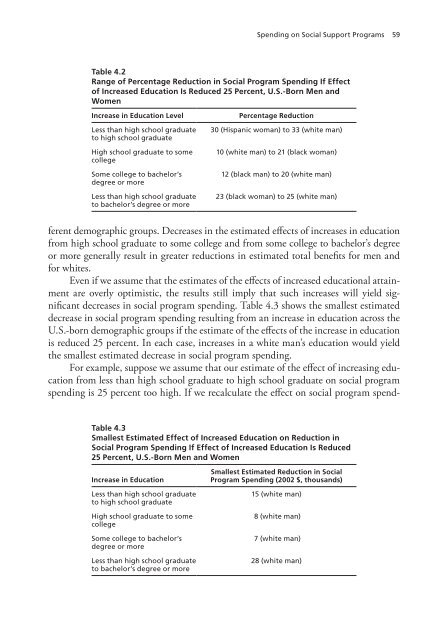
decreases <strong>in</strong> social program spend<strong>in</strong>g. Table 4.3 shows the smallest estimated<br />
decrease <strong>in</strong> social program spend<strong>in</strong>g result<strong>in</strong>g <strong>from</strong> an <strong>in</strong>crease <strong>in</strong> education across the<br />
U.S.-born demographic groups if the estimate of the effects of the <strong>in</strong>crease <strong>in</strong> education<br />
is reduced 25 percent. In each case, <strong>in</strong>creases <strong>in</strong> a white man’s education would yield<br />
the smallest estimated decrease <strong>in</strong> social program spend<strong>in</strong>g.<br />
For example, suppose we assume that our estimate of the effect of <strong>in</strong>creas<strong>in</strong>g education<br />
<strong>from</strong> less than high school graduate <strong>to</strong> high school graduate on social program<br />
spend<strong>in</strong>g is 25 percent <strong>to</strong>o high. If we recalculate the effect on social program spend-<br />
Table 4.3<br />
Smallest Estimated Effect of Increased Education on Reduction <strong>in</strong><br />
Social Program Spend<strong>in</strong>g If Effect of Increased Education Is Reduced<br />
25 Percent, U.S.-Born Men and Women<br />
Increase <strong>in</strong> Education<br />
Less than high school graduate<br />
<strong>to</strong> high school graduate<br />
High school graduate <strong>to</strong> some<br />
college<br />
Some college <strong>to</strong> bachelor’s<br />
degree or more<br />
Less than high school graduate<br />
<strong>to</strong> bachelor’s degree or more<br />
Smallest Estimated Reduction <strong>in</strong> Social<br />
Program Spend<strong>in</strong>g (2002 $, thousands)<br />
15 (white man)<br />
8 (white man)<br />
7 (white man)<br />
28 (white man)


