

rural-urban dynamics_report.pdf - Khazar University
rural-urban dynamics_report.pdf - Khazar University
rural-urban dynamics_report.pdf - Khazar University

You also want an ePaper? Increase the reach of your titles
YUMPU automatically turns print PDFs into web optimized ePapers that Google loves.
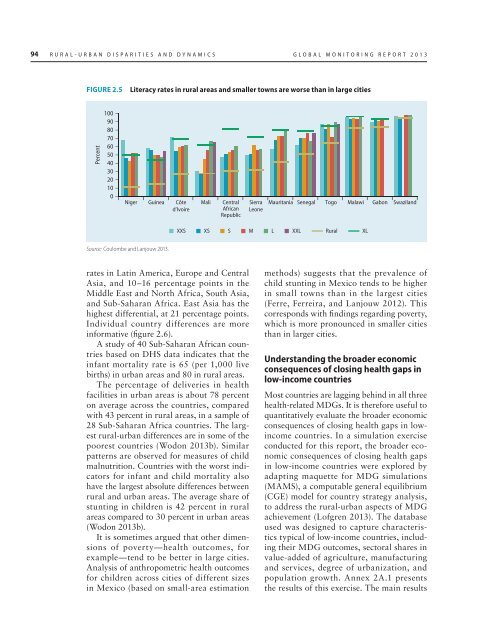
94 RURAL-URBAN DISPARITIES AND DYNAMICS GLOBAL MONITORING REPORT 2013<br />
FIGURE 2.5<br />
Literacy rates in <strong>rural</strong> areas and smaller towns are worse than in large cities<br />
Percent<br />
100<br />
90<br />
80<br />
70<br />
60<br />
50<br />
40<br />
30<br />
20<br />
10<br />
0<br />
Niger Guinea Côte<br />
d’Ivoire<br />
Mali<br />
Central<br />
African<br />
Republic<br />
Sierra<br />
Leone<br />
Mauritania Senegal Togo Malawi Gabon Swaziland<br />
XXS XS S M L XXL Rural XL<br />
Source: Coulombe and Lanjouw 2013.<br />
rates in Latin America, Europe and Central<br />
Asia, and 10–16 percentage points in the<br />
Middle East and North Africa, South Asia,<br />
and Sub-Saharan Africa. East Asia has the<br />
highest differential, at 21 percentage points.<br />
Individual country differences are more<br />
informative (figure 2.6).<br />
A study of 40 Sub-Saharan African countries<br />
based on DHS data indicates that the<br />
infant mortality rate is 65 (per 1,000 live<br />
births) in <strong>urban</strong> areas and 80 in <strong>rural</strong> areas.<br />
The percentage of deliveries in health<br />
facilities in <strong>urban</strong> areas is about 78 percent<br />
on average across the countries, compared<br />
with 43 percent in <strong>rural</strong> areas, in a sample of<br />
28 Sub-Saharan Africa countries. The largest<br />
<strong>rural</strong>-<strong>urban</strong> differences are in some of the<br />
poorest countries (Wodon 2013b). Similar<br />
patterns are observed for measures of child<br />
malnutrition. Countries with the worst indicators<br />
for infant and child mortality also<br />
have the largest absolute differences between<br />
<strong>rural</strong> and <strong>urban</strong> areas. The average share of<br />
stunting in children is 42 percent in <strong>rural</strong><br />
areas compared to 30 percent in <strong>urban</strong> areas<br />
(Wodon 2013b).<br />
It is sometimes argued that other dimensions<br />
of poverty—health outcomes, for<br />
example—tend to be better in large cities.<br />
Analysis of anthropometric health outcomes<br />
for children across cities of different sizes<br />
in Mexico (based on small-area estimation<br />
methods) suggests that the prevalence of<br />
child stunting in Mexico tends to be higher<br />
in small towns than in the largest cities<br />
(Ferre, Ferreira, and Lanjouw 2012). This<br />
corresponds with findings regarding poverty,<br />
which is more pronounced in smaller cities<br />
than in larger cities.<br />
Understanding the broader economic<br />
consequences of closing health gaps in<br />
low-income countries<br />
Most countries are lagging behind in all three<br />
health-related MDGs. It is therefore useful to<br />
quantitatively evaluate the broader economic<br />
consequences of closing health gaps in lowincome<br />
countries. In a simulation exercise<br />
conducted for this <strong>report</strong>, the broader economic<br />
consequences of closing health gaps<br />
in low-income countries were explored by<br />
adapting maquette for MDG simulations<br />
(MAMS), a computable general equilibrium<br />
(CGE) model for country strategy analysis,<br />
to address the <strong>rural</strong>-<strong>urban</strong> aspects of MDG<br />
achievement (Lofgren 2013). The database<br />
used was designed to capture characteristics<br />
typical of low-income countries, including<br />
their MDG outcomes, sectoral shares in<br />
value-added of agriculture, manufacturing<br />
and services, degree of <strong>urban</strong>ization, and<br />
population growth. Annex 2A.1 presents<br />
the results of this exercise. The main results


