

rural-urban dynamics_report.pdf - Khazar University
rural-urban dynamics_report.pdf - Khazar University
rural-urban dynamics_report.pdf - Khazar University

You also want an ePaper? Increase the reach of your titles
YUMPU automatically turns print PDFs into web optimized ePapers that Google loves.
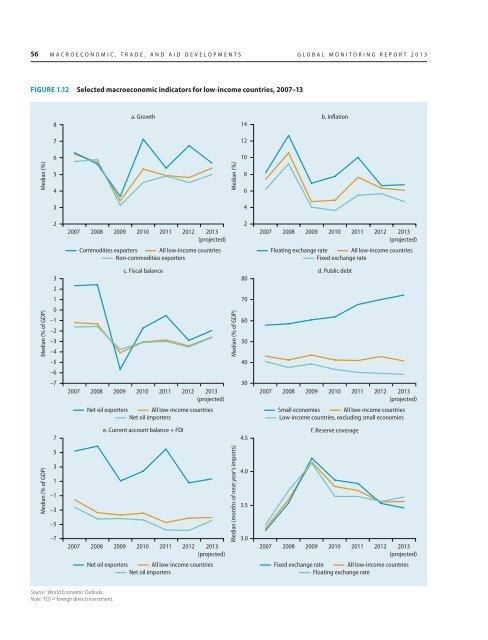
56 MACROECONOMIC, TRADE, AND AID DEVELOPMENTS GLOBAL MONITORING REPORT 2013<br />
FIGURE 1.12 Selected macroeconomic indicators for low-income countries, 2007–13<br />
Median (%)<br />
8<br />
7<br />
6<br />
5<br />
4<br />
3<br />
a. Growth b. Inflation<br />
14<br />
12<br />
10<br />
Median (%)<br />
8<br />
6<br />
4<br />
2<br />
2007 2008 2009 2010 2011 2012 2013<br />
(projected)<br />
2<br />
2007 2008 2009 2010 2011 2012 2013<br />
(projected)<br />
Commodities exporters All low-income countries<br />
Non-commodities exporters<br />
Floating exchange rate All low-income countries<br />
Fixed exchange rate<br />
Median (% of GDP)<br />
3<br />
2<br />
1<br />
0<br />
–1<br />
–2<br />
–3<br />
–4<br />
–5<br />
–6<br />
–7<br />
7<br />
c. Fiscal balance d. Public debt<br />
80<br />
2007 2008 2009 2010 2011 2012 2013<br />
(projected)<br />
Net oil exporters All low-income countries<br />
Net oil importers<br />
Median (% of GDP)<br />
2007 2008 2009 2010 2011 2012 2013<br />
(projected)<br />
e. Current account balance + FDI f. Reserve coverage<br />
4.5<br />
70<br />
60<br />
50<br />
40<br />
30<br />
Small economies All low-income countries<br />
Low-income countries, excluding small economies<br />
Median (% of GDP)<br />
5<br />
3<br />
1<br />
–1<br />
–3<br />
–5<br />
–7<br />
2007 2008 2009 2010 2011 2012 2013<br />
(projected)<br />
Net oil exporters All low-income countries<br />
Net oil importers<br />
Median (months of next year’s imports)<br />
4.0<br />
3.5<br />
3.0<br />
2007 2008 2009 2010 2011 2012 2013<br />
(projected)<br />
Fixed exchange rate All low-income countries<br />
Floating exchange rate<br />
Source: World Economic Outlook.<br />
Note: FDI = foreign direct investment.


