

INTEGRATED PROTECTED AREA CO-MANAGEMENT (IPAC) - BIDS
INTEGRATED PROTECTED AREA CO-MANAGEMENT (IPAC) - BIDS
INTEGRATED PROTECTED AREA CO-MANAGEMENT (IPAC) - BIDS

Create successful ePaper yourself
Turn your PDF publications into a flip-book with our unique Google optimized e-Paper software.
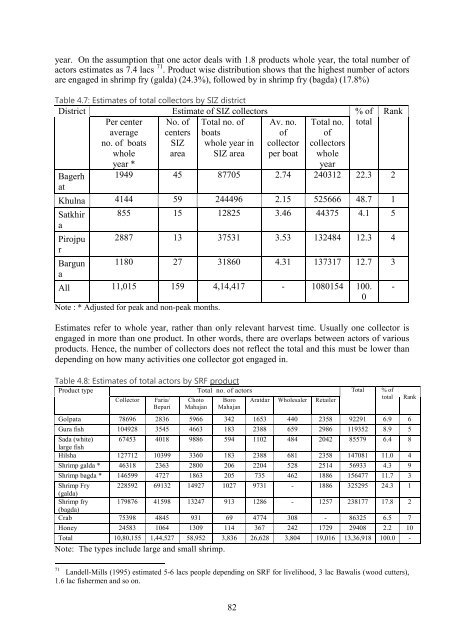
year. On the assumption that one actor deals with 1.8 products whole year, the total number of<br />
actors estimates as 7.4 lacs 71 . Product wise distribution shows that the highest number of actors<br />
are engaged in shrimp fry (galda) (24.3%), followed by in shrimp fry (bagda) (17.8%)<br />
Table 4.7: Estimates of total collectors by SIZ district<br />
District<br />
Estimate of SIZ collectors<br />
% of Rank<br />
Per center<br />
average<br />
no. of boats<br />
whole<br />
year *<br />
No. of<br />
centers<br />
SIZ<br />
area<br />
Total no. of<br />
boats<br />
whole year in<br />
SIZ area<br />
Av. no.<br />
of<br />
collector<br />
per boat<br />
Total no.<br />
of<br />
collectors<br />
whole<br />
year<br />
total<br />
Bagerh 1949 45 87705 2.74 240312 22.3 2<br />
at<br />
Khulna 4144 59 244496 2.15 525666 48.7 1<br />
Satkhir 855 15 12825 3.46 44375 4.1 5<br />
a<br />
Pirojpu 2887 13 37531 3.53 132484 12.3 4<br />
r<br />
Bargun 1180 27 31860 4.31 137317 12.7 3<br />
a<br />
All 11,015 159 4,14,417 - 1080154 100. -<br />
0<br />
Note : * Adjusted for peak and non-peak months.<br />
Estimates refer to whole year, rather than only relevant harvest time. Usually one collector is<br />
engaged in more than one product. In other words, there are overlaps between actors of various<br />
products. Hence, the number of collectors does not reflect the total and this must be lower than<br />
depending on how many activities one collector got engaged in.<br />
Table 4.8: Estimates of total actors by SRF product<br />
Product type<br />
Total no. of actors<br />
Collector<br />
Faria/<br />
Bepari<br />
Choto<br />
Mahajan<br />
Boro<br />
Mahajan<br />
Aratdar Wholesaler Retailer<br />
Golpata 78696 2836 5966 342 1653 440 2358 92291 6.9 6<br />
Gura fish 104928 3545 4663 183 2388 659 2986 119352 8.9 5<br />
Sada (white) 67453 4018 9886 594 1102 484 2042 85579 6.4 8<br />
large fish<br />
Hilsha 127712 10399 3360 183 2388 681 2358 147081 11.0 4<br />
Shrimp galda * 46318 2363 2800 206 2204 528 2514 56933 4.3 9<br />
Shrimp bagda * 146599 4727 1863 205 735 462 1886 156477 11.7 3<br />
Shrimp Fry 228592 69132 14927 1027 9731 - 1886 325295 24.3 1<br />
(galda)<br />
Shrimp fry 179876 41598 13247 913 1286 - 1257 238177 17.8 2<br />
(bagda)<br />
Crab 75398 4845 931 69 4774 308 - 86325 6.5 7<br />
Honey 24583 1064 1309 114 367 242 1729 29408 2.2 10<br />
Total 10,80,155 1,44,527 58,952 3,836 26,628 3,804 19,016 13,36,918 100.0 -<br />
Note: The types include large and small shrimp.<br />
Total<br />
% of<br />
total<br />
Rank<br />
71<br />
Landell-Mills (1995) estimated 5-6 lacs people depending on SRF for livelihood, 3 lac Bawalis (wood cutters),<br />
1.6 lac fishermen and so on.<br />
82


