- Page 1 and 2:
INTEGRATED PROTECTED AREA CO-MANAGE
- Page 3:
Washington, DC 20036 202-289-0100 F
- Page 6 and 7:
money lenders) who were often suspi
- Page 8 and 9:
2.1 Profile of SIZ Districts ......
- Page 10 and 11:
5.3.6 Shrimp Small (galda and bagda
- Page 12 and 13:
Table 3.13: Distance of harvest pla
- Page 14 and 15:
Table 5.20: Distribution of SRF act
- Page 16 and 17:
Figure 5.1: Basic structure of SRF
- Page 18 and 19:
Figure 5.55: Distribution of income
- Page 20 and 21:
Acronyms and Abbreviations ACF = As
- Page 22 and 23:
Glossary Arat Aratdar Bahaddar Baza
- Page 24 and 25:
In particular, the study is expecte
- Page 26 and 27:
Characteristics of SRF Actors and P
- Page 28 and 29:
The most difficult problem that had
- Page 30 and 31:
GDP and Livelihoods Based on availa
- Page 32 and 33:
Occupation Pattern of SRF Collector
- Page 34 and 35:
Chapter 4: Mapping for Core Steps a
- Page 36 and 37:
Nevertheless, the shrimp fry collec
- Page 38 and 39:
Crab Chain: Collector ⇒ Mahajan
- Page 40 and 41:
Value addition and return for gura
- Page 42 and 43:
Value addition and return for hilsh
- Page 44 and 45:
Wholesaler 3.1 26.1 19.3 Retailer 1
- Page 46 and 47:
Crab Crab collectors provide the hi
- Page 48 and 49:
Distribution of Actors Income - Inc
- Page 50 and 51:
Shrimp Large (galda and bagda) The
- Page 52 and 53:
Majhis/Beparis (9.5 %), Choto Mahaj
- Page 54 and 55:
of value chains, in terms of return
- Page 56 and 57:
Service Centers and Financial Suppo
- Page 58 and 59:
those leased-out canals. There shou
- Page 60 and 61:
Infrastructure of web-cam through o
- Page 62 and 63:
Chapter 1: Introduction, Study Back
- Page 64 and 65:
Although the resource users are bla
- Page 66 and 67:
advocates of conservation in return
- Page 68 and 69:
1.4.1 Principal Tools Briefly, the
- Page 70 and 71:
Shrimps have been divided into four
- Page 72 and 73:
In the process of our consultations
- Page 74 and 75:
The value chain framework, which is
- Page 76 and 77:
The study carries out micro level a
- Page 78 and 79:
an idea about possible market power
- Page 80 and 81:
Table 1.4: Usual harvest time of SR
- Page 82 and 83:
others, occupational pattern, incom
- Page 84 and 85:
Chapter 2: SIZ District and Upazila
- Page 86:
Map 2.2: Map of SIZ Districts: Khul
- Page 89 and 90:
Table 2.2: Proportion of SIZ area a
- Page 91 and 92:
SIZ 58 55.7 93 44.5 5 25 Districts
- Page 93 and 94:
Figure 2.5: Per capita district GDP
- Page 95 and 96:
Figure 2.7: SIZ per capita lands by
- Page 97 and 98:
CHAPTER 3 FINDINGS FROM THE SURVEY
- Page 99 and 100:
Satkhira 60 25.3 Pirojpur 11 4.6 Ba
- Page 101 and 102:
Retailer 107.2 30.2 All 87.5 48.7 F
- Page 103 and 104:
Like in other harvests, some of the
- Page 105 and 106:
Aratdars (11.6%) and Farias/Beparis
- Page 107 and 108:
Table 3.13: Distance of harvest pla
- Page 109 and 110:
Hantal 1.0 16.0 1.0 1.0 19.0 All 1.
- Page 111 and 112:
8.Unemployed 7.Self-employed 6.Cons
- Page 113 and 114:
Table 3.19: Repayment mode in SRF t
- Page 115 and 116:
In spite of the above, dadon is pre
- Page 117 and 118:
Incidence of pests 8.9 24.9 48.1 7.
- Page 119 and 120:
• Set up hand-driven tube-well at
- Page 121 and 122:
3.5 Historical Moratorium on SRF Pr
- Page 123 and 124:
Chandpai .15* - 1.62** .16* .17* .1
- Page 125 and 126:
CHAPTER 4 MAPPING FOR CORE STEPS AN
- Page 127 and 128:
Table 4.1: Sectors and products und
- Page 129 and 130:
We start with timber 4.3.1 Timber -
- Page 131 and 132:
4.3.3 Fish The fish sector consists
- Page 134 and 135:
Shrimp (Galda and Bagda) Chain 1: F
- Page 136 and 137:
Flow chart 4.8: Value chain for Cra
- Page 138 and 139:
Average number of boats involved in
- Page 140 and 141:
ola Khulna 1019 200 58 31 10 2 12 1
- Page 142 and 143:
year. On the assumption that one ac
- Page 144 and 145:
600 569 000 no. 500 400 300 200 225
- Page 146 and 147:
Table 4.11: Proportions of SRF prod
- Page 148 and 149:
Figure 4.7: Volume of products (%)
- Page 150 and 151:
Chapter 5: Value Chain Analysis for
- Page 152 and 153:
Beparis sell, in addition to Choto
- Page 154 and 155:
Volume of trade The price value add
- Page 156 and 157:
5.2.2 Gura Fish As large network of
- Page 158 and 159:
140 Gura fish selling price (Tk per
- Page 160 and 161:
A specific group of people having g
- Page 162 and 163: Sada fish gross return (monthly) by
- Page 164 and 165: Net/boat owners are actually Mahaja
- Page 166 and 167: Figure 5.17: Hilsha gross return (T
- Page 168 and 169: Gross returns and net returns Aratd
- Page 170 and 171: Figure 5.23: Shrimp galda large net
- Page 172 and 173: Figure 5.25: Shrimp bagda large sel
- Page 174 and 175: Table 5.7: Value addition and retur
- Page 176 and 177: Figure 5.31: Shrimp galda small net
- Page 178 and 179: Figure 5.36: Shrimp bagda small val
- Page 180 and 181: Average selling Price/piece Price V
- Page 182 and 183: Figure 5.40: Shrimp fry galda value
- Page 184 and 185: Shrimp fry bagda value addition (%)
- Page 186 and 187: Crab gross return (monthly) by acto
- Page 188 and 189: Note: See note under Table 5.1. (10
- Page 190 and 191: Honey net return (monthly) by actor
- Page 192 and 193: The degree of inequality is quite h
- Page 194 and 195: Cumulative income share (%) 100 80
- Page 196 and 197: Figure 5.59: Lorenz curve: Gura fis
- Page 198 and 199: Decile 8 14.6 Decile 9 17.9 Decile
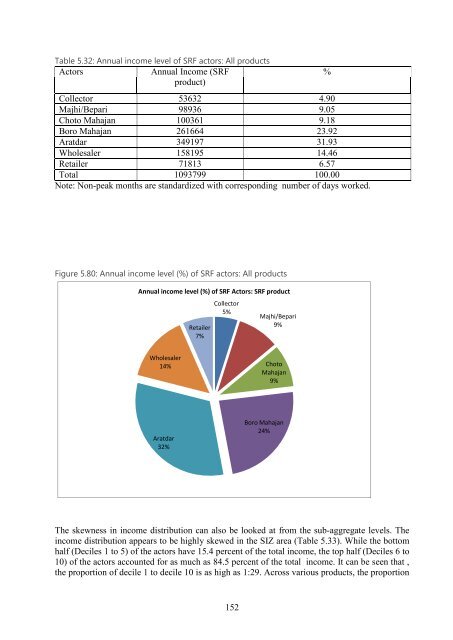
- Page 200 and 201: Annual income level (%) of SRF Acto
- Page 202 and 203: Actors Monthly income Duration (Mon
- Page 204 and 205: Table 5.24: Annual income level of
- Page 206 and 207: Annual income level (%) of SRF Acto
- Page 208 and 209: anking actors, it can be seen that
- Page 210 and 211: In terms of distribution by deciles
- Page 214 and 215: Decile 3 2.9 Decile 4 3.9 Decile 5
- Page 216 and 217: CHAPTER 6 CONCLUDING REMARKS AND PO
- Page 218 and 219: actors community). Our survey findi
- Page 220 and 221: The foremost policy, therefore, wil
- Page 222 and 223: nets” to the collectors, along wi
- Page 224 and 225: empowerment, awareness and overall
- Page 226 and 227: of co-management. That co-managemen
- Page 228 and 229: SRF collectors as a major problem o
- Page 230 and 231: the problem as very high is more th
- Page 232 and 233: Bernacsek, G. and E. Haque (2001).
- Page 234 and 235: Kleih Ulrich (2003). “Fish Distri


