influence du climat et de la prédation sur l'utilisation de l'habitat et la ...
influence du climat et de la prédation sur l'utilisation de l'habitat et la ...
influence du climat et de la prédation sur l'utilisation de l'habitat et la ...
You also want an ePaper? Increase the reach of your titles
YUMPU automatically turns print PDFs into web optimized ePapers that Google loves.
90<br />
Statistical analyses<br />
Habitat selecti on<br />
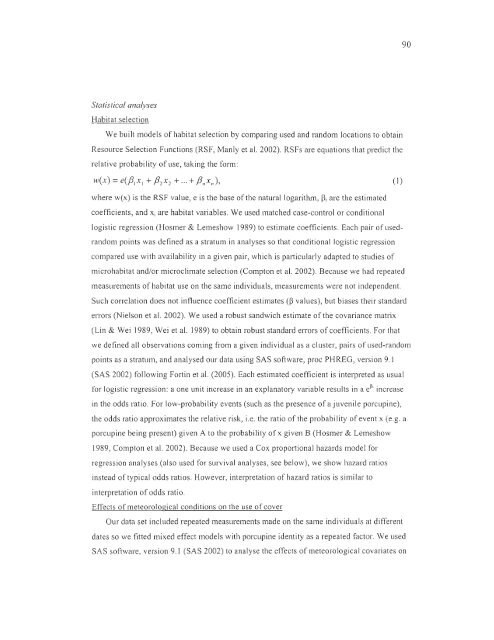
We built mo<strong>de</strong>ls of habitat selection by comparing used and random locati ons to obtain<br />
Resource Selection Functions (RSF, Manly <strong>et</strong> al. 2002). RSFs are equati ons that predi ct the<br />
re<strong>la</strong>ti ve probabil ity of use, taking the form:<br />
(1)<br />
where w(x) is the RSF value, e is the base of the naturallogarithm, ~ i are the estimated<br />
coeffi cients, and Xi are habitat variables. We used matched case-control or conditional<br />
logisti c regression (Hosmer & Lemeshow 1989) to estimate coeffi cients. Each pair of usedrandom<br />
points was <strong>de</strong>fined as a stratum in analyses so that conditional logisti c regression<br />
compared use with avai<strong>la</strong>bility in a given pair, whi ch is parti cu<strong>la</strong>rly adapted to studies of<br />
microhabi tat and/or micro<strong>climat</strong>e selecti on (Compton <strong>et</strong> al. 2002). Because we had repeated<br />
mea<strong>sur</strong>ements of habitat use on the same indivi<strong>du</strong>als, mea<strong>sur</strong>ements were not in<strong>de</strong>pen<strong>de</strong>nt.<br />
Such corre<strong>la</strong>ti on does not <strong>influence</strong> coefficient estimates (~ values), but biases their standard<br />
errors (Nielson <strong>et</strong> al. 2002). We used a robust sandwich estimate of the covariance matrix<br />
(Lin & Wei 1989, Wei <strong>et</strong> al. 1989) to obtain robust standard en-ors of coefficients. For that<br />
we <strong>de</strong>fined ail observati ons coming fro m a given indivi<strong>du</strong>al as a cluster, pairs of used-random<br />
points as a stratum, and analysed our data using SAS software, proc PHREG, vers ion 9.1<br />
(SAS 2002) fo llowing Fortin <strong>et</strong> al. (2005). Each estimated coeffi cient is interpr<strong>et</strong>ed as usual<br />
fo r logisti c regression: a one unit increase in an exp<strong>la</strong>natory variable results in a e Pi increase<br />
in the odds ratio. For low-probability events (such as the presence of a juvenile porcupine),<br />
the odds rati o approximates the re<strong>la</strong>tive ri sk, i.e. the ratio of the probability of event x (e.g. a<br />
porcupine being present) given A to the probability of x given B (Hosmer & Lemeshow<br />
1989, Compton <strong>et</strong> al. 2002). Because we used a Cox proporti onal hazards mo<strong>de</strong>l fo r<br />
regression analyses (also used fo r <strong>sur</strong>vival analyses, see below), we show hazard rati os<br />
instead of typical odds ratios. However, interpr<strong>et</strong>ati on of hazard ratios is simi<strong>la</strong>r to<br />
in te rpr<strong>et</strong>ation of odds ratio.<br />
Effects of m<strong>et</strong>eorological conditions on the use of coyer<br />
Our data s<strong>et</strong> inclu<strong>de</strong>d repeated mea<strong>sur</strong>ements ma<strong>de</strong> on the same indivi<strong>du</strong>als at di fferent<br />
dates so we fi tted mixed effect mo<strong>de</strong>ls with porcupine i<strong>de</strong>ntity as a repeated factor. We used<br />
SAS software, version 9. 1 (SAS 2002) to analyse the effects of m<strong>et</strong>eorological covari ates on


