influence du climat et de la prédation sur l'utilisation de l'habitat et la ...
influence du climat et de la prédation sur l'utilisation de l'habitat et la ...
influence du climat et de la prédation sur l'utilisation de l'habitat et la ...
You also want an ePaper? Increase the reach of your titles
YUMPU automatically turns print PDFs into web optimized ePapers that Google loves.
XI<br />
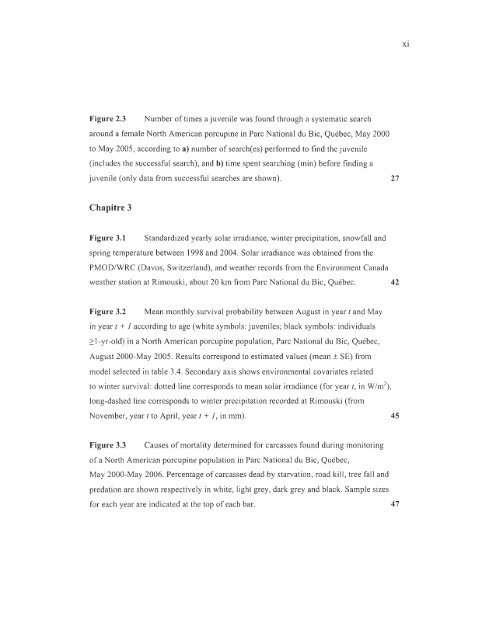
Figure 2.3 Number oftimes ajuvenile was found through a systematic se arch<br />
around a female North American porcupine in Parc National <strong>du</strong> Bic, Québec, May 2000<br />
to May 2005, according to a) number of search(es) performed to find the juvenile<br />
(inclu<strong>de</strong>s the successful search), and b) time spent searching (min) before finding a<br />
juvenile (only data from successful searches are shown).<br />
27<br />
Chapitre 3<br />
Figure 3.1 Standardized yearly so<strong>la</strong>r irradiance, winter precipitation, snowfall and<br />
spring temperature b<strong>et</strong>ween 1998 and 2004. So<strong>la</strong>r irradiance was obtained from the<br />
PMOD/WRC (Davos, Switzer<strong>la</strong>nd), and weather records from the Environment Canada<br />
weather station at Rimouski, about 20 km from Parc National <strong>du</strong> Bic, Québec. 42<br />
Figure 3.2 Mean monthly <strong>sur</strong>vival probability b<strong>et</strong>ween August in year t and May<br />
in year t + 1 according to age (white symbols: juveniles; b<strong>la</strong>ck symbols: indivi<strong>du</strong>als<br />
:::: l-yr-old) in a North American porcupine popu<strong>la</strong>tion, Parc National <strong>du</strong> Bic, Québec,<br />
August 2000-May 2005. Results correspond to estimated values (mean ± SE) from<br />
mo<strong>de</strong>l selected in table 3.4. Secondary axis shows environmental covariates re<strong>la</strong>ted<br />
to winter <strong>sur</strong>vival: dotted line corresponds to me an so<strong>la</strong>r irradiance (for year t, in W/m 2 ) ,<br />
long-dashed line cOiTesponds to winter precipitation recor<strong>de</strong>d at Rimouski (from<br />
November, year t to April, year t + 1, in mm). 45<br />
Figure 3.3 Causes of mortality d<strong>et</strong>ermined for carcasses found <strong>du</strong>ring monitoring<br />
of a North American porcupine popu<strong>la</strong>tion in Parc National <strong>du</strong> Bic, Québec,<br />
May 2000-May 2006. Percentage of carcasses <strong>de</strong>ad by starvation, road kill, tree fall and<br />
predation are shown respectively in white, light grey, dark grey and b<strong>la</strong>ck. Sample sizes<br />
for each year are indicated at the top of each bar. 47


