influence du climat et de la prédation sur l'utilisation de l'habitat et la ...
influence du climat et de la prédation sur l'utilisation de l'habitat et la ...
influence du climat et de la prédation sur l'utilisation de l'habitat et la ...

Create successful ePaper yourself
Turn your PDF publications into a flip-book with our unique Google optimized e-Paper software.
65<br />
feeding behaviour for the popu<strong>la</strong>tion (obtained from Fig. 4.3). Means were computed over six<br />
c<strong>la</strong>sses of Te «-19.9°e, -19.9 to -15°C, -14.9 to -10°C, -9.9 to -5°C, -4.9 to ooe and >O°C).<br />
We therefore obtained a time spent feeding for each indivi<strong>du</strong>al and for each c<strong>la</strong>ss of Tc. We<br />
tested wh<strong>et</strong>her time spent feeding differed b<strong>et</strong>ween sexes and b<strong>et</strong>ween c<strong>la</strong>sses of Tc using<br />
ANOY As. We perfonned multiple comparisons b<strong>et</strong>ween c<strong>la</strong>sses of Tc using post hoc tests.<br />
4.4. Results<br />
M<strong>et</strong>eorological conditions<br />
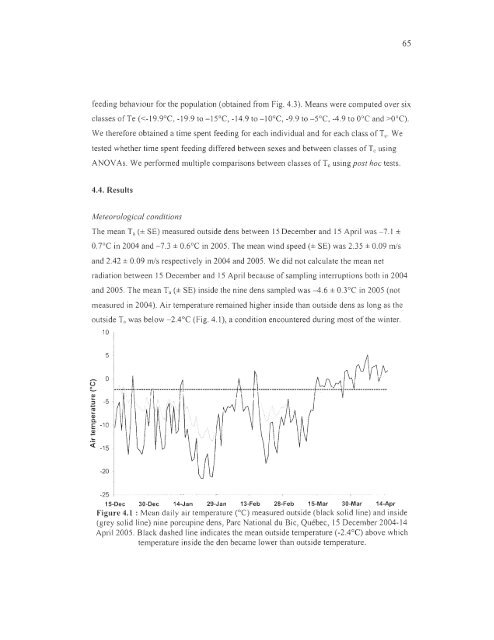
The mean Ta (± SE) mea<strong>sur</strong>ed outsi<strong>de</strong> <strong>de</strong>ns b<strong>et</strong>ween 15 December and 15 April was -7.1 ±<br />
0.7°e in 2004 and -7.3 ± 0.6°e in 2005. The mean wind speed (± SE) was 2.35 ± 0.09 mis<br />
and 2.42 ± 0.09 mis respectively in 2004 and 2005. We did not ca\cu<strong>la</strong>te the mean n<strong>et</strong><br />
radiation b<strong>et</strong>ween 15 December and 15 April because of sampling interruptions both in 2004<br />
and 2005. The mean Ta (± SE) insi<strong>de</strong> the nine <strong>de</strong>ns sampled was --4.6 ± 0.3°e in 2005 (not<br />
mea<strong>sur</strong>ed in 2004). Air temperature remained higher insi<strong>de</strong> th an outsi<strong>de</strong> <strong>de</strong>ns as long as the<br />
outsi<strong>de</strong> Ta was below -2.4 oC (Fig. 4.\), a condition encountered <strong>du</strong>ring most of the winter.<br />
10<br />
5<br />
~ : ..:......._-,.._<br />
..<br />
.a v; 1\ " 1 /V<br />
CIl<br />
...<br />
CI><br />
a.<br />
E -10<br />
CI><br />
-...<br />
Ci: -15<br />
..... _~ .. _._ .... _<br />
.._.._<br />
_.~~~<br />
.:._......._...._... \ ~ /<br />
-20<br />
-25<br />
15-Dec 30-Dec 14-Jan 29-Jan 13-Feb 28-Feb 15-Mar 30-Mar 14-Apr<br />
ine) and insi<strong>de</strong><br />
Figure 4.1 : Mean daily air temperature (oC) mea<strong>sur</strong>ed outsi<strong>de</strong> (b<strong>la</strong>ck solid 1<br />
(grey solid line) nine porcupine <strong>de</strong>ns, Parc National <strong>du</strong> Bic, Québec, 15 December 2004-14<br />
April 2005. B<strong>la</strong>ck dashed line indicates the mean outsi<strong>de</strong> temperature (-2.4°C) above which<br />
temperature insi<strong>de</strong> the <strong>de</strong>n became lower than outsi<strong>de</strong> temperature.