

Synthesis of Safety for Traffic Operations - Transports Canada
Synthesis of Safety for Traffic Operations - Transports Canada
Synthesis of Safety for Traffic Operations - Transports Canada

Create successful ePaper yourself
Turn your PDF publications into a flip-book with our unique Google optimized e-Paper software.
<strong>Synthesis</strong> <strong>of</strong> <strong>Safety</strong> <strong>for</strong> <strong>Traffic</strong> <strong>Operations</strong> March 2003<br />
CHAPTER 8: LEGISLATION AND ENFORCEMENT<br />
Speed Limits<br />
Ullman and Dudek (1987)<br />
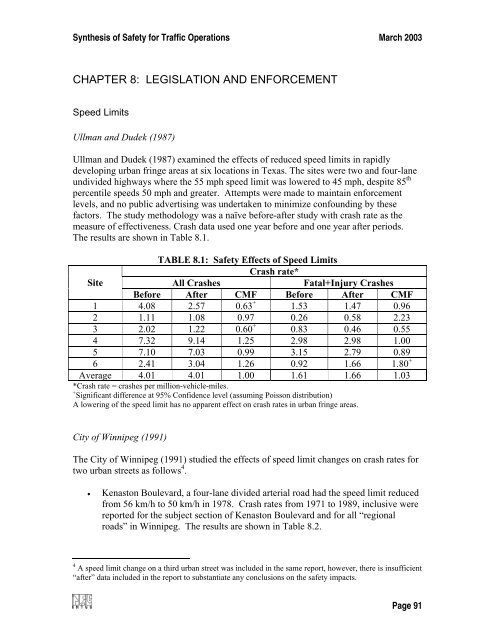
Ullman and Dudek (1987) examined the effects <strong>of</strong> reduced speed limits in rapidly<br />
developing urban fringe areas at six locations in Texas. The sites were two and four-lane<br />
undivided highways where the 55 mph speed limit was lowered to 45 mph, despite 85 th<br />
percentile speeds 50 mph and greater. Attempts were made to maintain en<strong>for</strong>cement<br />
levels, and no public advertising was undertaken to minimize confounding by these<br />
factors. The study methodology was a naïve be<strong>for</strong>e-after study with crash rate as the<br />
measure <strong>of</strong> effectiveness. Crash data used one year be<strong>for</strong>e and one year after periods.<br />
The results are shown in Table 8.1.<br />
TABLE 8.1: <strong>Safety</strong> Effects <strong>of</strong> Speed Limits<br />
Crash rate*<br />
Site<br />
All Crashes<br />
Fatal+Injury Crashes<br />
Be<strong>for</strong>e After CMF Be<strong>for</strong>e After CMF<br />
1 4.08 2.57 0.63 + 1.53 1.47 0.96<br />
2 1.11 1.08 0.97 0.26 0.58 2.23<br />
3 2.02 1.22 0.60 + 0.83 0.46 0.55<br />
4 7.32 9.14 1.25 2.98 2.98 1.00<br />
5 7.10 7.03 0.99 3.15 2.79 0.89<br />
6 2.41 3.04 1.26 0.92 1.66 1.80 +<br />
Average 4.01 4.01 1.00 1.61 1.66 1.03<br />
*Crash rate = crashes per million-vehicle-miles.<br />
+ Significant difference at 95% Confidence level (assuming Poisson distribution)<br />
A lowering <strong>of</strong> the speed limit has no apparent effect on crash rates in urban fringe areas.<br />
City <strong>of</strong> Winnipeg (1991)<br />
The City <strong>of</strong> Winnipeg (1991) studied the effects <strong>of</strong> speed limit changes on crash rates <strong>for</strong><br />
two urban streets as follows 4 .<br />
• Kenaston Boulevard, a four-lane divided arterial road had the speed limit reduced<br />
from 56 km/h to 50 km/h in 1978. Crash rates from 1971 to 1989, inclusive were<br />
reported <strong>for</strong> the subject section <strong>of</strong> Kenaston Boulevard and <strong>for</strong> all “regional<br />
roads” in Winnipeg. The results are shown in Table 8.2.<br />
4 A speed limit change on a third urban street was included in the same report, however, there is insufficient<br />
“after” data included in the report to substantiate any conclusions on the safety impacts.<br />
Page 91


