

Synthesis of Safety for Traffic Operations - Transports Canada
Synthesis of Safety for Traffic Operations - Transports Canada
Synthesis of Safety for Traffic Operations - Transports Canada

Create successful ePaper yourself
Turn your PDF publications into a flip-book with our unique Google optimized e-Paper software.
<strong>Synthesis</strong> <strong>of</strong> <strong>Safety</strong> <strong>for</strong> <strong>Traffic</strong> <strong>Operations</strong> March 2003<br />
include only the crashes that occurred during the same months as was available in the<br />
“after” period.<br />
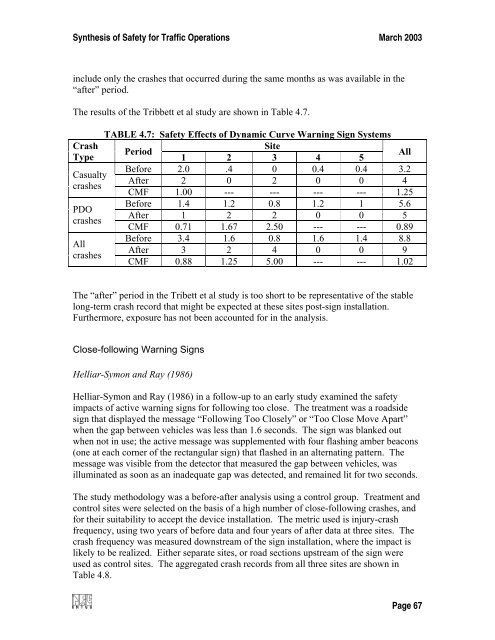
The results <strong>of</strong> the Tribbett et al study are shown in Table 4.7.<br />
Crash<br />
Type<br />
Casualty<br />
crashes<br />
PDO<br />
crashes<br />
All<br />
crashes<br />
TABLE 4.7: <strong>Safety</strong> Effects <strong>of</strong> Dynamic Curve Warning Sign Systems<br />
Period<br />
Site<br />
1 2 3 4 5<br />
All<br />
Be<strong>for</strong>e 2.0 .4 0 0.4 0.4 3.2<br />
After 2 0 2 0 0 4<br />
CMF 1.00 --- --- --- --- 1.25<br />
Be<strong>for</strong>e 1.4 1.2 0.8 1.2 1 5.6<br />
After 1 2 2 0 0 5<br />
CMF 0.71 1.67 2.50 --- --- 0.89<br />
Be<strong>for</strong>e 3.4 1.6 0.8 1.6 1.4 8.8<br />
After 3 2 4 0 0 9<br />
CMF 0.88 1.25 5.00 --- --- 1.02<br />
The “after” period in the Tribett et al study is too short to be representative <strong>of</strong> the stable<br />
long-term crash record that might be expected at these sites post-sign installation.<br />
Furthermore, exposure has not been accounted <strong>for</strong> in the analysis.<br />
Close-following Warning Signs<br />
Helliar-Symon and Ray (1986)<br />
Helliar-Symon and Ray (1986) in a follow-up to an early study examined the safety<br />
impacts <strong>of</strong> active warning signs <strong>for</strong> following too close. The treatment was a roadside<br />
sign that displayed the message “Following Too Closely” or “Too Close Move Apart”<br />
when the gap between vehicles was less than 1.6 seconds. The sign was blanked out<br />
when not in use; the active message was supplemented with four flashing amber beacons<br />
(one at each corner <strong>of</strong> the rectangular sign) that flashed in an alternating pattern. The<br />
message was visible from the detector that measured the gap between vehicles, was<br />
illuminated as soon as an inadequate gap was detected, and remained lit <strong>for</strong> two seconds.<br />
The study methodology was a be<strong>for</strong>e-after analysis using a control group. Treatment and<br />
control sites were selected on the basis <strong>of</strong> a high number <strong>of</strong> close-following crashes, and<br />
<strong>for</strong> their suitability to accept the device installation. The metric used is injury-crash<br />
frequency, using two years <strong>of</strong> be<strong>for</strong>e data and four years <strong>of</strong> after data at three sites. The<br />
crash frequency was measured downstream <strong>of</strong> the sign installation, where the impact is<br />
likely to be realized. Either separate sites, or road sections upstream <strong>of</strong> the sign were<br />
used as control sites. The aggregated crash records from all three sites are shown in<br />
Table 4.8.<br />
Page 67


