

Synthesis of Safety for Traffic Operations - Transports Canada
Synthesis of Safety for Traffic Operations - Transports Canada
Synthesis of Safety for Traffic Operations - Transports Canada

Create successful ePaper yourself
Turn your PDF publications into a flip-book with our unique Google optimized e-Paper software.
<strong>Synthesis</strong> <strong>of</strong> <strong>Safety</strong> <strong>for</strong> <strong>Traffic</strong> <strong>Operations</strong> March 2003<br />
• Pedestrian flow<br />
• <strong>Safety</strong> problem being addressed (target crashes)<br />
• Description <strong>of</strong> the treatment<br />
• Number <strong>of</strong> crashes by severity in the be<strong>for</strong>e and after periods<br />
The manner in which MOLASSES sites are selected <strong>for</strong> treatment is unknown.<br />
There<strong>for</strong>e, regression-to-the-mean effects may cause efficacy estimates to be inflated. In<br />
addition, the estimates are based on be<strong>for</strong>e-after studies <strong>of</strong> crash frequency. There is a<br />
failure to account <strong>for</strong> changes in exposure or other potential confounding factors.<br />
Limited in<strong>for</strong>mation is available from the MOLASSES database without sending a<br />
tailored request to the TRL. Nonetheless, the safety impacts <strong>of</strong> new signals in urban<br />
areas, and in rural areas are as shown in Table 3.11.<br />
TABLE 3.11: <strong>Safety</strong> Effects <strong>of</strong> Signal Installation in the United Kingdom<br />
Setting<br />
Number <strong>of</strong> Number <strong>of</strong> Crashes<br />
Installations Be<strong>for</strong>e After<br />
CMF<br />
Urban 26 323 144 0.45<br />
Rural 8 93 20 0.22<br />
Bauer and Harwood (2000)<br />
Bauer and Harwood (2000) developed SPFs <strong>for</strong> urban, four-leg intersections using three<br />
years <strong>of</strong> crash and infrastructure data from Cali<strong>for</strong>nia. Lognormal and loglinear<br />
regression was per<strong>for</strong>med on the dataset described in Table 3.12.<br />
TABLE 3.12: Intersection Characteristics <strong>for</strong> SPFs from Cali<strong>for</strong>nia<br />
Characteristic Stop-controlled Signal-controlled<br />
No. <strong>of</strong> intersections 1342 1306<br />
ADT<br />
Major 1100 – 79000 2400 – 79000<br />
Minor 100 – 16940 101 – 48000<br />
Mean No. <strong>of</strong><br />
All 7.4 23.4<br />
Crashes Fatal+Injury 3.3 9.6<br />
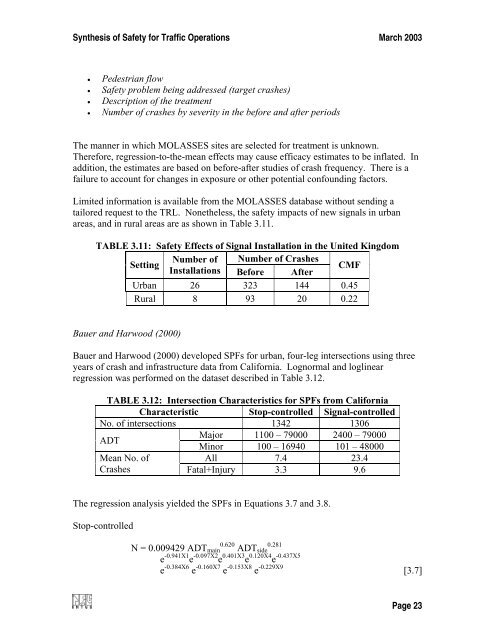
The regression analysis yielded the SPFs in Equations 3.7 and 3.8.<br />
Stop-controlled<br />
N = 0.009429 ADT main 0.620 ADT side<br />
0.281<br />
e -0.941X1 e -0.097X2 e 0.401X3 e 0.120X4 e -0.437X5<br />
e -0.384X6 e -0.160X7 e -0.153X8 e -0.229X9 [3.7]<br />
Page 23


