

Synthesis of Safety for Traffic Operations - Transports Canada
Synthesis of Safety for Traffic Operations - Transports Canada
Synthesis of Safety for Traffic Operations - Transports Canada

Create successful ePaper yourself
Turn your PDF publications into a flip-book with our unique Google optimized e-Paper software.
<strong>Synthesis</strong> <strong>of</strong> <strong>Safety</strong> <strong>for</strong> <strong>Traffic</strong> <strong>Operations</strong> March 2003<br />
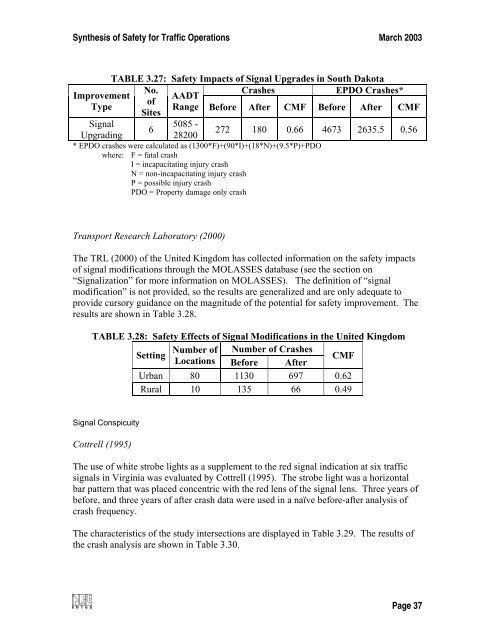
TABLE 3.27: <strong>Safety</strong> Impacts <strong>of</strong> Signal Upgrades in South Dakota<br />
No.<br />
Crashes<br />
EPDO Crashes*<br />
Improvement AADT<br />
<strong>of</strong><br />
Type<br />
Range Be<strong>for</strong>e After CMF Be<strong>for</strong>e After CMF<br />
Sites<br />
Signal<br />
5085 -<br />
6<br />
272 180 0.66 4673 2635.5 0.56<br />
Upgrading<br />
28200<br />
* EPDO crashes were calculated as (1300*F)+(90*I)+(18*N)+(9.5*P)+PDO<br />
where: F = fatal crash<br />
I = incapacitating injury crash<br />
N = non-incapacitating injury crash<br />
P = possible injury crash<br />
PDO = Property damage only crash<br />
Transport Research Laboratory (2000)<br />
The TRL (2000) <strong>of</strong> the United Kingdom has collected in<strong>for</strong>mation on the safety impacts<br />
<strong>of</strong> signal modifications through the MOLASSES database (see the section on<br />
“Signalization” <strong>for</strong> more in<strong>for</strong>mation on MOLASSES). The definition <strong>of</strong> “signal<br />
modification” is not provided, so the results are generalized and are only adequate to<br />
provide cursory guidance on the magnitude <strong>of</strong> the potential <strong>for</strong> safety improvement. The<br />
results are shown in Table 3.28.<br />
TABLE 3.28: <strong>Safety</strong> Effects <strong>of</strong> Signal Modifications in the United Kingdom<br />
Number <strong>of</strong> Number <strong>of</strong> Crashes<br />
Setting<br />
Locations Be<strong>for</strong>e After<br />
CMF<br />
Urban 80 1130 697 0.62<br />
Rural 10 135 66 0.49<br />
Signal Conspicuity<br />
Cottrell (1995)<br />
The use <strong>of</strong> white strobe lights as a supplement to the red signal indication at six traffic<br />
signals in Virginia was evaluated by Cottrell (1995). The strobe light was a horizontal<br />
bar pattern that was placed concentric with the red lens <strong>of</strong> the signal lens. Three years <strong>of</strong><br />
be<strong>for</strong>e, and three years <strong>of</strong> after crash data were used in a naïve be<strong>for</strong>e-after analysis <strong>of</strong><br />
crash frequency.<br />
The characteristics <strong>of</strong> the study intersections are displayed in Table 3.29. The results <strong>of</strong><br />
the crash analysis are shown in Table 3.30.<br />
Page 37


