

Synthesis of Safety for Traffic Operations - Transports Canada
Synthesis of Safety for Traffic Operations - Transports Canada
Synthesis of Safety for Traffic Operations - Transports Canada

You also want an ePaper? Increase the reach of your titles
YUMPU automatically turns print PDFs into web optimized ePapers that Google loves.
<strong>Synthesis</strong> <strong>of</strong> <strong>Safety</strong> <strong>for</strong> <strong>Traffic</strong> <strong>Operations</strong> March 2003<br />
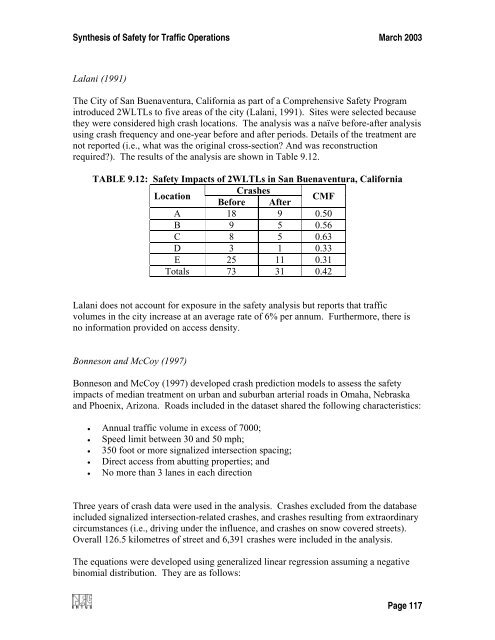
Lalani (1991)<br />
The City <strong>of</strong> San Buenaventura, Cali<strong>for</strong>nia as part <strong>of</strong> a Comprehensive <strong>Safety</strong> Program<br />
introduced 2WLTLs to five areas <strong>of</strong> the city (Lalani, 1991). Sites were selected because<br />
they were considered high crash locations. The analysis was a naïve be<strong>for</strong>e-after analysis<br />
using crash frequency and one-year be<strong>for</strong>e and after periods. Details <strong>of</strong> the treatment are<br />
not reported (i.e., what was the original cross-section? And was reconstruction<br />
required?). The results <strong>of</strong> the analysis are shown in Table 9.12.<br />
TABLE 9.12: <strong>Safety</strong> Impacts <strong>of</strong> 2WLTLs in San Buenaventura, Cali<strong>for</strong>nia<br />
Location<br />
Crashes<br />
Be<strong>for</strong>e After<br />
CMF<br />
A 18 9 0.50<br />
B 9 5 0.56<br />
C 8 5 0.63<br />
D 3 1 0.33<br />
E 25 11 0.31<br />
Totals 73 31 0.42<br />
Lalani does not account <strong>for</strong> exposure in the safety analysis but reports that traffic<br />
volumes in the city increase at an average rate <strong>of</strong> 6% per annum. Furthermore, there is<br />
no in<strong>for</strong>mation provided on access density.<br />
Bonneson and McCoy (1997)<br />
Bonneson and McCoy (1997) developed crash prediction models to assess the safety<br />
impacts <strong>of</strong> median treatment on urban and suburban arterial roads in Omaha, Nebraska<br />
and Phoenix, Arizona. Roads included in the dataset shared the following characteristics:<br />
• Annual traffic volume in excess <strong>of</strong> 7000;<br />
• Speed limit between 30 and 50 mph;<br />
• 350 foot or more signalized intersection spacing;<br />
• Direct access from abutting properties; and<br />
• No more than 3 lanes in each direction<br />
Three years <strong>of</strong> crash data were used in the analysis. Crashes excluded from the database<br />
included signalized intersection-related crashes, and crashes resulting from extraordinary<br />
circumstances (i.e., driving under the influence, and crashes on snow covered streets).<br />
Overall 126.5 kilometres <strong>of</strong> street and 6,391 crashes were included in the analysis.<br />
The equations were developed using generalized linear regression assuming a negative<br />
binomial distribution. They are as follows:<br />
Page 117


