

Synthesis of Safety for Traffic Operations - Transports Canada
Synthesis of Safety for Traffic Operations - Transports Canada
Synthesis of Safety for Traffic Operations - Transports Canada

Create successful ePaper yourself
Turn your PDF publications into a flip-book with our unique Google optimized e-Paper software.
<strong>Synthesis</strong> <strong>of</strong> <strong>Safety</strong> <strong>for</strong> <strong>Traffic</strong> <strong>Operations</strong> March 2003<br />
from the model indicates that the speed limit had no predictive value in determining crash<br />
frequency. In other words, it does not appear as if the speed limit had any impact on<br />
crash frequency.<br />
Haselton (2001)<br />
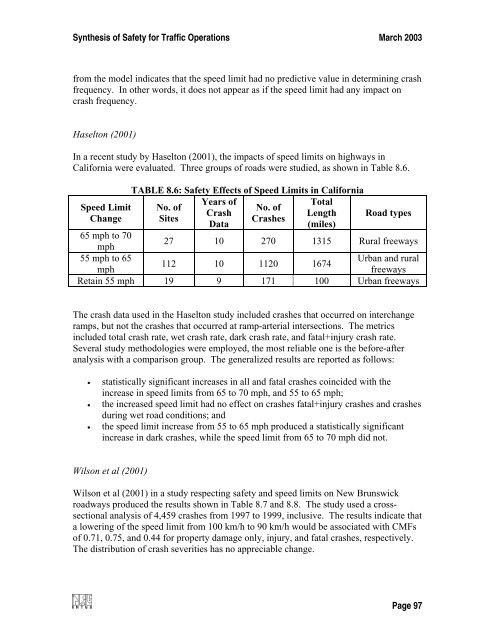
In a recent study by Haselton (2001), the impacts <strong>of</strong> speed limits on highways in<br />
Cali<strong>for</strong>nia were evaluated. Three groups <strong>of</strong> roads were studied, as shown in Table 8.6.<br />
Speed Limit<br />
Change<br />
TABLE 8.6: <strong>Safety</strong> Effects <strong>of</strong> Speed Limits in Cali<strong>for</strong>nia<br />
Years <strong>of</strong><br />
Total<br />
No. <strong>of</strong><br />
No. <strong>of</strong><br />
Crash<br />
Length<br />
Sites<br />
Crashes<br />
Data<br />
(miles)<br />
Road types<br />
65 mph to 70<br />
27 10 270 1315 Rural freeways<br />
mph<br />
55 mph to 65<br />
Urban and rural<br />
112 10 1120 1674<br />
mph<br />
freeways<br />
Retain 55 mph 19 9 171 100 Urban freeways<br />
The crash data used in the Haselton study included crashes that occurred on interchange<br />
ramps, but not the crashes that occurred at ramp-arterial intersections. The metrics<br />
included total crash rate, wet crash rate, dark crash rate, and fatal+injury crash rate.<br />
Several study methodologies were employed, the most reliable one is the be<strong>for</strong>e-after<br />
analysis with a comparison group. The generalized results are reported as follows:<br />
• statistically significant increases in all and fatal crashes coincided with the<br />
increase in speed limits from 65 to 70 mph, and 55 to 65 mph;<br />
• the increased speed limit had no effect on crashes fatal+injury crashes and crashes<br />
during wet road conditions; and<br />
• the speed limit increase from 55 to 65 mph produced a statistically significant<br />
increase in dark crashes, while the speed limit from 65 to 70 mph did not.<br />
Wilson et al (2001)<br />
Wilson et al (2001) in a study respecting safety and speed limits on New Brunswick<br />
roadways produced the results shown in Table 8.7 and 8.8. The study used a crosssectional<br />
analysis <strong>of</strong> 4,459 crashes from 1997 to 1999, inclusive. The results indicate that<br />
a lowering <strong>of</strong> the speed limit from 100 km/h to 90 km/h would be associated with CMFs<br />
<strong>of</strong> 0.71, 0.75, and 0.44 <strong>for</strong> property damage only, injury, and fatal crashes, respectively.<br />
The distribution <strong>of</strong> crash severities has no appreciable change.<br />
Page 97


