

Synthesis of Safety for Traffic Operations - Transports Canada
Synthesis of Safety for Traffic Operations - Transports Canada
Synthesis of Safety for Traffic Operations - Transports Canada

You also want an ePaper? Increase the reach of your titles
YUMPU automatically turns print PDFs into web optimized ePapers that Google loves.
Intersection Control<br />
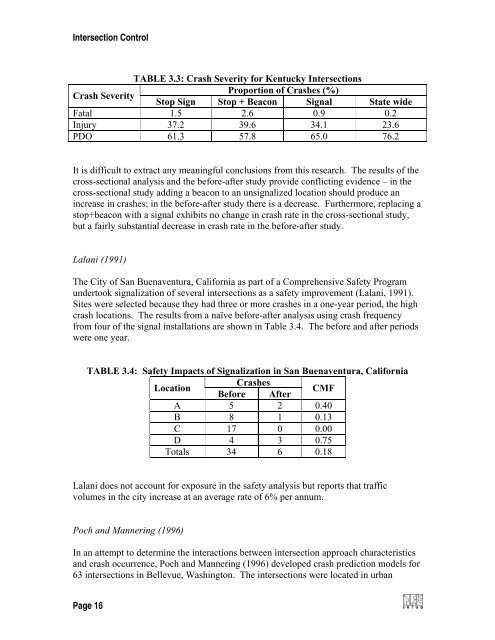
TABLE 3.3: Crash Severity <strong>for</strong> Kentucky Intersections<br />
Crash Severity<br />
Proportion <strong>of</strong> Crashes (%)<br />
Stop Sign Stop + Beacon Signal State wide<br />
Fatal 1.5 2.6 0.9 0.2<br />
Injury 37.2 39.6 34.1 23.6<br />
PDO 61.3 57.8 65.0 76.2<br />
It is difficult to extract any meaningful conclusions from this research. The results <strong>of</strong> the<br />
cross-sectional analysis and the be<strong>for</strong>e-after study provide conflicting evidence – in the<br />
cross-sectional study adding a beacon to an unsignalized location should produce an<br />
increase in crashes; in the be<strong>for</strong>e-after study there is a decrease. Furthermore, replacing a<br />
stop+beacon with a signal exhibits no change in crash rate in the cross-sectional study,<br />
but a fairly substantial decrease in crash rate in the be<strong>for</strong>e-after study.<br />
Lalani (1991)<br />
The City <strong>of</strong> San Buenaventura, Cali<strong>for</strong>nia as part <strong>of</strong> a Comprehensive <strong>Safety</strong> Program<br />
undertook signalization <strong>of</strong> several intersections as a safety improvement (Lalani, 1991).<br />
Sites were selected because they had three or more crashes in a one-year period, the high<br />
crash locations. The results from a naïve be<strong>for</strong>e-after analysis using crash frequency<br />
from four <strong>of</strong> the signal installations are shown in Table 3.4. The be<strong>for</strong>e and after periods<br />
were one year.<br />
TABLE 3.4: <strong>Safety</strong> Impacts <strong>of</strong> Signalization in San Buenaventura, Cali<strong>for</strong>nia<br />
Location<br />
Crashes<br />
Be<strong>for</strong>e After<br />
CMF<br />
A 5 2 0.40<br />
B 8 1 0.13<br />
C 17 0 0.00<br />
D 4 3 0.75<br />
Totals 34 6 0.18<br />
Lalani does not account <strong>for</strong> exposure in the safety analysis but reports that traffic<br />
volumes in the city increase at an average rate <strong>of</strong> 6% per annum.<br />
Poch and Mannering (1996)<br />
In an attempt to determine the interactions between intersection approach characteristics<br />
and crash occurrence, Poch and Mannering (1996) developed crash prediction models <strong>for</strong><br />
63 intersections in Bellevue, Washington. The intersections were located in urban<br />
Page 16


