

Synthesis of Safety for Traffic Operations - Transports Canada
Synthesis of Safety for Traffic Operations - Transports Canada
Synthesis of Safety for Traffic Operations - Transports Canada

Create successful ePaper yourself
Turn your PDF publications into a flip-book with our unique Google optimized e-Paper software.
<strong>Synthesis</strong> <strong>of</strong> <strong>Safety</strong> <strong>for</strong> <strong>Traffic</strong> <strong>Operations</strong> March 2003<br />
There is a great potential <strong>for</strong> the results <strong>of</strong> this research to mislead the practitioner. First<br />
and <strong>for</strong>emost, the study methodology is a naïve be<strong>for</strong>e-after study and there<strong>for</strong>e does not<br />
account <strong>for</strong> confounders or regression to the mean effects (although the site selection was<br />
not undertaken on the basis <strong>of</strong> a high incidence <strong>of</strong> collisions, there<strong>for</strong>e regression to the<br />
mean effects are likely not as troublesome).<br />
A speed limit reduction is indicated on the roadway by a change in speed limit signing.<br />
While this is certainly a change to the “road” part <strong>of</strong> the road-driver-vehicle system, it is<br />
unlikely that the revised signing by itself has any impact on safety. For the speed limit<br />
reduction to have any effect on safety, the signs must evoke a change in driver behaviour.<br />
The impetus <strong>for</strong> the modified behaviour is <strong>of</strong> no real concern in this discussion, but it<br />
suffices to say that the threat <strong>of</strong> being a larger fine may be the causal chain. At any rate,<br />
<strong>for</strong> the new speed limit to have an impact on safety, the new speed limit must also have<br />
an impact on driver behaviour. The conventional wisdom in this respect is that the<br />
average speed <strong>of</strong> the traffic stream is not affected, but the variation in speeds among the<br />
travel stream is affected. As the speed limit is moved closer to the 85 th percentile speed,<br />
the speed variance decreases, and as the speed limit is moved away from the 85 th<br />
percentile speed, the speed variance increases.<br />
Belanger (1994)<br />
Belanger (1994) studied the safety <strong>of</strong> unsignalized intersections with four approaches<br />
including an examination <strong>of</strong> the impacts <strong>of</strong> the main road speed limit on intersection<br />
safety. Belanger examined the safety <strong>of</strong> 149 intersections in eastern Quebec with average<br />
annual daily traffic volumes ranging from 388 to 15,942. Crashes that occurred within 30<br />
metres <strong>of</strong> the intersection, or were recorded as intersection-related were included in the<br />
analysis. Regression-to-the-mean effects were accounted <strong>for</strong> through the application <strong>of</strong> a<br />
multivariate Empirical Bayes technique.<br />
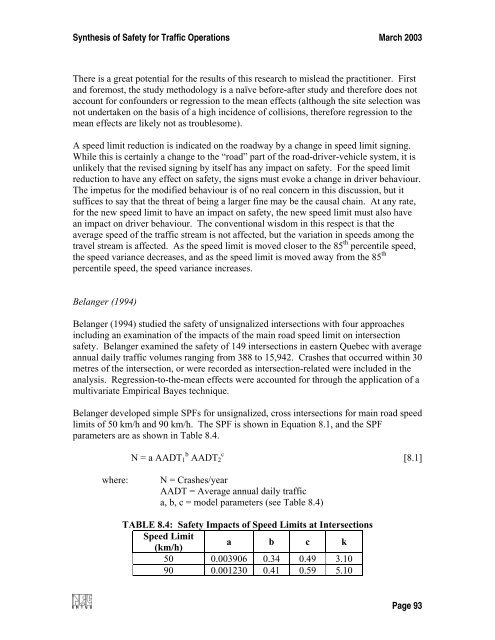
Belanger developed simple SPFs <strong>for</strong> unsignalized, cross intersections <strong>for</strong> main road speed<br />
limits <strong>of</strong> 50 km/h and 90 km/h. The SPF is shown in Equation 8.1, and the SPF<br />
parameters are as shown in Table 8.4.<br />
N = a AADT 1 b AADT 2<br />
c<br />
[8.1]<br />
where:<br />
N = Crashes/year<br />
AADT = Average annual daily traffic<br />
a, b, c = model parameters (see Table 8.4)<br />
TABLE 8.4: <strong>Safety</strong> Impacts <strong>of</strong> Speed Limits at Intersections<br />
Speed Limit<br />
(km/h)<br />
a b c k<br />
50 0.003906 0.34 0.49 3.10<br />
90 0.001230 0.41 0.59 5.10<br />
Page 93


