

Synthesis of Safety for Traffic Operations - Transports Canada
Synthesis of Safety for Traffic Operations - Transports Canada
Synthesis of Safety for Traffic Operations - Transports Canada

You also want an ePaper? Increase the reach of your titles
YUMPU automatically turns print PDFs into web optimized ePapers that Google loves.
<strong>Traffic</strong> Signs<br />
determined through a comparison <strong>of</strong> equivalent property damage only crashes, using<br />
monetary conversations deemed appropriate by the investigation team. Three years <strong>of</strong><br />
be<strong>for</strong>e and three years <strong>of</strong> after crash data were used in the analysis.<br />
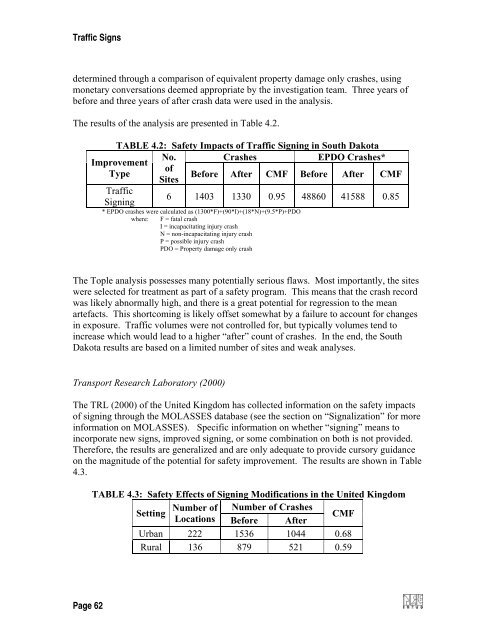
The results <strong>of</strong> the analysis are presented in Table 4.2.<br />
TABLE 4.2: <strong>Safety</strong> Impacts <strong>of</strong> <strong>Traffic</strong> Signing in South Dakota<br />
No. Crashes<br />
EPDO Crashes*<br />
Improvement<br />
<strong>of</strong><br />
Type<br />
Be<strong>for</strong>e After CMF Be<strong>for</strong>e After CMF<br />
Sites<br />
<strong>Traffic</strong><br />
6 1403 1330 0.95 48860 41588 0.85<br />
Signing<br />
* EPDO crashes were calculated as (1300*F)+(90*I)+(18*N)+(9.5*P)+PDO<br />
where: F = fatal crash<br />
I = incapacitating injury crash<br />
N = non-incapacitating injury crash<br />
P = possible injury crash<br />
PDO = Property damage only crash<br />
The Tople analysis possesses many potentially serious flaws. Most importantly, the sites<br />
were selected <strong>for</strong> treatment as part <strong>of</strong> a safety program. This means that the crash record<br />
was likely abnormally high, and there is a great potential <strong>for</strong> regression to the mean<br />
artefacts. This shortcoming is likely <strong>of</strong>fset somewhat by a failure to account <strong>for</strong> changes<br />
in exposure. <strong>Traffic</strong> volumes were not controlled <strong>for</strong>, but typically volumes tend to<br />
increase which would lead to a higher “after” count <strong>of</strong> crashes. In the end, the South<br />
Dakota results are based on a limited number <strong>of</strong> sites and weak analyses.<br />
Transport Research Laboratory (2000)<br />
The TRL (2000) <strong>of</strong> the United Kingdom has collected in<strong>for</strong>mation on the safety impacts<br />
<strong>of</strong> signing through the MOLASSES database (see the section on “Signalization” <strong>for</strong> more<br />
in<strong>for</strong>mation on MOLASSES). Specific in<strong>for</strong>mation on whether “signing” means to<br />
incorporate new signs, improved signing, or some combination on both is not provided.<br />
There<strong>for</strong>e, the results are generalized and are only adequate to provide cursory guidance<br />
on the magnitude <strong>of</strong> the potential <strong>for</strong> safety improvement. The results are shown in Table<br />
4.3.<br />
TABLE 4.3: <strong>Safety</strong> Effects <strong>of</strong> Signing Modifications in the United Kingdom<br />
Number <strong>of</strong> Number <strong>of</strong> Crashes<br />
Setting<br />
Locations Be<strong>for</strong>e After<br />
CMF<br />
Urban 222 1536 1044 0.68<br />
Rural 136 879 521 0.59<br />
Page 62


