- Page 1 and 2:
Transport Canada Transports Canada
- Page 4:
Synthesis Of Safety For Traffic Ope
- Page 8 and 9:
DISCLAIMER The material presented h
- Page 10 and 11:
EXECUTIVE SUMMARY Traffic operation
- Page 12 and 13:
Synthesis of Safety for Traffic Ope
- Page 14 and 15:
Synthesis of Safety for Traffic Ope
- Page 16 and 17:
TABLE OF CONTENTS DISCLAIMER REJET
- Page 18 and 19:
Synthesis of Safety for Traffic Ope
- Page 20 and 21:
LIST OF TABLES TABLE 3.1: Crash Rat
- Page 22 and 23:
Synthesis of Safety for Traffic Ope
- Page 24:
Chapter 1: Chapter 1: Introductio I
- Page 27 and 28:
Introduction Before proceeding, a f
- Page 29 and 30:
Introduction Literature regarding t
- Page 31 and 32:
Introduction The current science of
- Page 33 and 34:
Introduction adequate size control
- Page 35 and 36:
Introduction In concluding this sec
- Page 38 and 39:
Synthesis of Safety for Traffic Ope
- Page 40 and 41:
Synthesis of Safety for Traffic Ope
- Page 42:
Chapter 3: Chapter 3: Intersectio I
- Page 45 and 46:
Intersection Control TABLE 3.3: Cra
- Page 47 and 48:
Intersection Control TABLE 3.5: CMF
- Page 49 and 50:
Intersection Control Vancouver Regi
- Page 51 and 52:
Intersection Control V m = the sum
- Page 53 and 54:
Intersection Control where: X1 = 0
- Page 55 and 56:
Intersection Control Region of Durh
- Page 57 and 58:
Intersection Control TABLE 3.17: CM
- Page 59 and 60:
Intersection Control The predictor
- Page 61 and 62:
Intersection Control TABLE 3.23: CM
- Page 63 and 64:
Intersection Control program includ
- Page 65 and 66:
Intersection Control TABLE 3.26: Me
- Page 67 and 68:
Intersection Control TABLE 3.29: St
- Page 69 and 70:
Intersection Control TABLE 3.32: Ni
- Page 71 and 72:
Intersection Control TABLE 3.35: CM
- Page 73 and 74:
Intersection Control It is noted th
- Page 75 and 76:
Intersection Control Sayed et al (1
- Page 77 and 78:
Intersection Control Signal Clearan
- Page 79 and 80:
Intersection Control The CMFs are 0
- Page 81 and 82:
Intersection Control also examined
- Page 83 and 84: Intersection Control Shebeeb (1995)
- Page 85 and 86: Intersection Control approaches at
- Page 87 and 88: Intersection Control TABLE 3.54: CM
- Page 89 and 90: Intersection Control TABLE 3.56: Sa
- Page 92 and 93: Synthesis of Safety for Traffic Ope
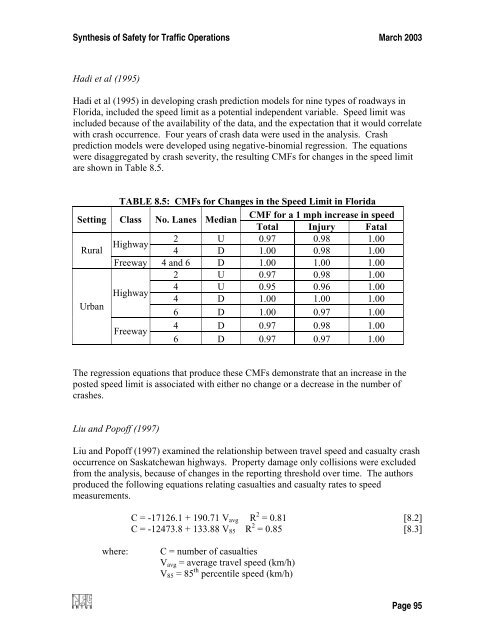
- Page 94 and 95: Synthesis of Safety for Traffic Ope
- Page 96 and 97: Synthesis of Safety for Traffic Ope
- Page 98 and 99: Synthesis of Safety for Traffic Ope
- Page 100 and 101: Synthesis of Safety for Traffic Ope
- Page 102: Chapter 5: Chapter 5: Pavement Pave
- Page 105 and 106: Pavement Markings The study methodo
- Page 107 and 108: Pavement Markings Hall (1987) Hall
- Page 109 and 110: Pavement Markings TABLE 5.8: Safety
- Page 111 and 112: Pavement Markings THIS PAGE IS INTE
- Page 114 and 115: Synthesis of Safety for Traffic Ope
- Page 116 and 117: Synthesis of Safety for Traffic Ope
- Page 118 and 119: Synthesis of Safety for Traffic Ope
- Page 120 and 121: Synthesis of Safety for Traffic Ope
- Page 122 and 123: Synthesis of Safety for Traffic Ope
- Page 124: Chapter 7: Chapter 7: Bicycle Bicyc
- Page 127 and 128: Bicycle Safety TABLE 7.1: Safety Im
- Page 130 and 131: Synthesis of Safety for Traffic Ope
- Page 132 and 133: Synthesis of Safety for Traffic Ope
- Page 136 and 137: Synthesis of Safety for Traffic Ope
- Page 138 and 139: Synthesis of Safety for Traffic Ope
- Page 140 and 141: Synthesis of Safety for Traffic Ope
- Page 142 and 143: Synthesis of Safety for Traffic Ope
- Page 144 and 145: Synthesis of Safety for Traffic Ope
- Page 146 and 147: Synthesis of Safety for Traffic Ope
- Page 148: Chapter 9: Chapter 9: Turn Lanes Tu
- Page 151 and 152: Turn Lanes TABLE 9.2: Safety Impact
- Page 153 and 154: Turn Lanes Vogt determined that a l
- Page 155 and 156: Turn Lanes 1998 one of their high c
- Page 157 and 158: Turn Lanes Section TABLE 9.10: Safe
- Page 159 and 160: Turn Lanes A T = ADT 0.91 L 0.852 e
- Page 161 and 162: Turn Lanes CMF = 1 - 0.7 P lt/d 0.0
- Page 163 and 164: Turn Lanes occurred within 250 feet
- Page 166 and 167: Synthesis of Safety for Traffic Ope
- Page 168 and 169: TABLE 10.3: Speed Changes Resulting
- Page 170 and 171: Sites Where Applied 1 URBAN Island
- Page 172 and 173: Forbes and Gill (2000) undertook a
- Page 174 and 175: Ideally, three years of before and
- Page 176 and 177: Kermit and Hein (1962) looked into
- Page 178 and 179: The effects of the transverse pavem
- Page 180: Chapter 11: Chapter 11: Other Other
- Page 183 and 184: Other Safety Issues collisions per
- Page 185 and 186:
Other Safety Issues THIS PAGE IS IN
- Page 188 and 189:
Synthesis of Safety for Traffic Ope
- Page 190 and 191:
Synthesis of Safety for Traffic Ope
- Page 192 and 193:
Synthesis of Safety for Traffic Ope
- Page 194 and 195:
Synthesis of Safety for Traffic Ope
- Page 196 and 197:
Synthesis of Safety for Traffic Ope
- Page 198 and 199:
Synthesis of Safety for Traffic Ope
- Page 200 and 201:
Synthesis of Safety for Traffic Ope
- Page 202 and 203:
Synthesis of Safety for Traffic Ope
- Page 204 and 205:
Synthesis of Safety for Traffic Ope
- Page 206 and 207:
Synthesis of Safety for Traffic Ope
- Page 208 and 209:
Synthesis of Safety for Traffic Ope
- Page 210 and 211:
Synthesis of Safety for Traffic Ope
- Page 212 and 213:
Synthesis of Safety for Traffic Ope
- Page 214 and 215:
Synthesis of Safety for Traffic Ope
- Page 216 and 217:
Synthesis of Safety for Traffic Ope
- Page 218 and 219:
Synthesis of Safety for Traffic Ope
- Page 220:
References References
- Page 223 and 224:
References Bloch SA (1998) “Compa
- Page 225 and 226:
References Hamilton Associates (199
- Page 227 and 228:
References Lee JT, Maleck TL, and T
- Page 229 and 230:
References Polanis SF (1998) “Do
- Page 231 and 232:
References Vancouver, City of (1999
- Page 233 and 234:
References THIS PAGE IS INTENTIONAL
- Page 236 and 237:
Synthesis of Safety for Traffic Ope
- Page 238 and 239:
Synthesis of Safety for Traffic Ope
- Page 240 and 241:
Synthesis of Safety for Traffic Ope
- Page 242:
Appendix B: Critical R Appendix B:
- Page 245 and 246:
Critical Reviews Worksheet for Eval
- Page 247 and 248:
Critical Reviews 2. Are the expecte
- Page 250 and 251:
Synthesis of Safety for Traffic Ope
- Page 252 and 253:
Synthesis of Safety for Traffic Ope
- Page 254 and 255:
Synthesis of Safety for Traffic Ope
- Page 256 and 257:
Synthesis of Safety for Traffic Ope
- Page 258:
Appendix D: Appendix D: How to Use
- Page 261 and 262:
How to Use Safety Performance Funct
- Page 263 and 264:
How to Use Safety Performance Funct