Synthesis of Safety for Traffic Operations - Transports Canada
Synthesis of Safety for Traffic Operations - Transports Canada
Synthesis of Safety for Traffic Operations - Transports Canada
You also want an ePaper? Increase the reach of your titles
YUMPU automatically turns print PDFs into web optimized ePapers that Google loves.
Intersection Control<br />
Vancouver Regional District, and Vancouver Island. The dataset included 186<br />
intersections with three-legs and 233 intersections with four legs. Three years <strong>of</strong> data<br />
were used in the model development, sites were selected on the basis <strong>of</strong> available data.<br />
Only one-way (at T-intersections) and two-way (at cross intersections) stop controlled<br />
intersections were included in the analysis. Crashes that were within 30 metres <strong>of</strong> the<br />
intersection, or were coded as “intersection-related” were defined as intersection crashes.<br />
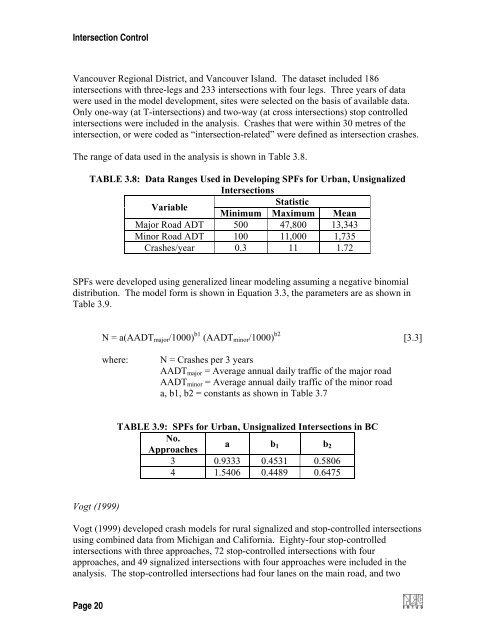
The range <strong>of</strong> data used in the analysis is shown in Table 3.8.<br />
TABLE 3.8: Data Ranges Used in Developing SPFs <strong>for</strong> Urban, Unsignalized<br />
Intersections<br />
Variable<br />
Statistic<br />
Minimum Maximum Mean<br />
Major Road ADT 500 47,800 13,343<br />
Minor Road ADT 100 11,000 1,735<br />
Crashes/year 0.3 11 1.72<br />
SPFs were developed using generalized linear modeling assuming a negative binomial<br />
distribution. The model <strong>for</strong>m is shown in Equation 3.3, the parameters are as shown in<br />
Table 3.9.<br />
N = a(AADT major /1000) b1 (AADT minor /1000) b2 [3.3]<br />
where:<br />
N = Crashes per 3 years<br />
AADT major = Average annual daily traffic <strong>of</strong> the major road<br />
AADT minor = Average annual daily traffic <strong>of</strong> the minor road<br />
a, b1, b2 = constants as shown in Table 3.7<br />
TABLE 3.9: SPFs <strong>for</strong> Urban, Unsignalized Intersections in BC<br />
No.<br />
Approaches<br />
a b 1 b 2<br />
3 0.9333 0.4531 0.5806<br />
4 1.5406 0.4489 0.6475<br />
Vogt (1999)<br />
Vogt (1999) developed crash models <strong>for</strong> rural signalized and stop-controlled intersections<br />
using combined data from Michigan and Cali<strong>for</strong>nia. Eighty-four stop-controlled<br />
intersections with three approaches, 72 stop-controlled intersections with four<br />
approaches, and 49 signalized intersections with four approaches were included in the<br />
analysis. The stop-controlled intersections had four lanes on the main road, and two<br />
Page 20


