

Synthesis of Safety for Traffic Operations - Transports Canada
Synthesis of Safety for Traffic Operations - Transports Canada
Synthesis of Safety for Traffic Operations - Transports Canada

Create successful ePaper yourself
Turn your PDF publications into a flip-book with our unique Google optimized e-Paper software.
<strong>Synthesis</strong> <strong>of</strong> <strong>Safety</strong> <strong>for</strong> <strong>Traffic</strong> <strong>Operations</strong> March 2003<br />
Horizontal Curve Signing and Marking<br />
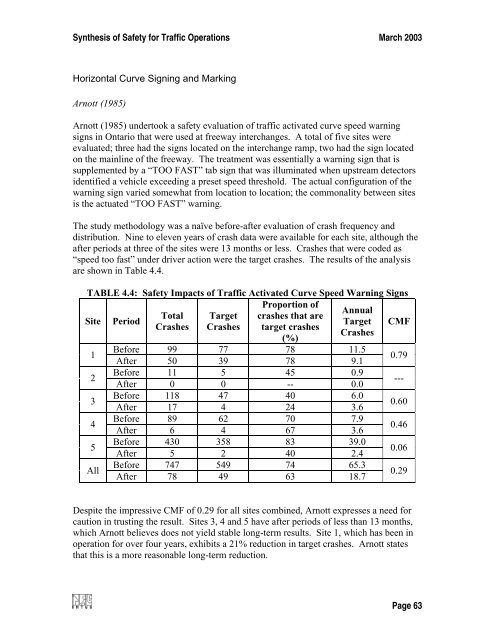
Arnott (1985)<br />
Arnott (1985) undertook a safety evaluation <strong>of</strong> traffic activated curve speed warning<br />
signs in Ontario that were used at freeway interchanges. A total <strong>of</strong> five sites were<br />
evaluated; three had the signs located on the interchange ramp, two had the sign located<br />
on the mainline <strong>of</strong> the freeway. The treatment was essentially a warning sign that is<br />
supplemented by a “TOO FAST” tab sign that was illuminated when upstream detectors<br />
identified a vehicle exceeding a preset speed threshold. The actual configuration <strong>of</strong> the<br />
warning sign varied somewhat from location to location; the commonality between sites<br />
is the actuated “TOO FAST” warning.<br />
The study methodology was a naïve be<strong>for</strong>e-after evaluation <strong>of</strong> crash frequency and<br />
distribution. Nine to eleven years <strong>of</strong> crash data were available <strong>for</strong> each site, although the<br />
after periods at three <strong>of</strong> the sites were 13 months or less. Crashes that were coded as<br />
“speed too fast” under driver action were the target crashes. The results <strong>of</strong> the analysis<br />
are shown in Table 4.4.<br />
TABLE 4.4: <strong>Safety</strong> Impacts <strong>of</strong> <strong>Traffic</strong> Activated Curve Speed Warning Signs<br />
Site Period<br />
Proportion <strong>of</strong><br />
Annual<br />
Total Target crashes that are<br />
Target<br />
Crashes Crashes target crashes<br />
Crashes<br />
(%)<br />
CMF<br />
1<br />
Be<strong>for</strong>e 99 77 78 11.5<br />
After 50 39 78 9.1<br />
0.79<br />
2<br />
Be<strong>for</strong>e 11 5 45 0.9<br />
After 0 0 -- 0.0<br />
---<br />
3<br />
Be<strong>for</strong>e 118 47 40 6.0<br />
After 17 4 24 3.6<br />
0.60<br />
4<br />
Be<strong>for</strong>e 89 62 70 7.9<br />
After 6 4 67 3.6<br />
0.46<br />
5<br />
Be<strong>for</strong>e 430 358 83 39.0<br />
After 5 2 40 2.4<br />
0.06<br />
All<br />
Be<strong>for</strong>e 747 549 74 65.3<br />
After 78 49 63 18.7<br />
0.29<br />
Despite the impressive CMF <strong>of</strong> 0.29 <strong>for</strong> all sites combined, Arnott expresses a need <strong>for</strong><br />
caution in trusting the result. Sites 3, 4 and 5 have after periods <strong>of</strong> less than 13 months,<br />
which Arnott believes does not yield stable long-term results. Site 1, which has been in<br />
operation <strong>for</strong> over four years, exhibits a 21% reduction in target crashes. Arnott states<br />
that this is a more reasonable long-term reduction.<br />
Page 63


