

Synthesis of Safety for Traffic Operations - Transports Canada
Synthesis of Safety for Traffic Operations - Transports Canada
Synthesis of Safety for Traffic Operations - Transports Canada

You also want an ePaper? Increase the reach of your titles
YUMPU automatically turns print PDFs into web optimized ePapers that Google loves.
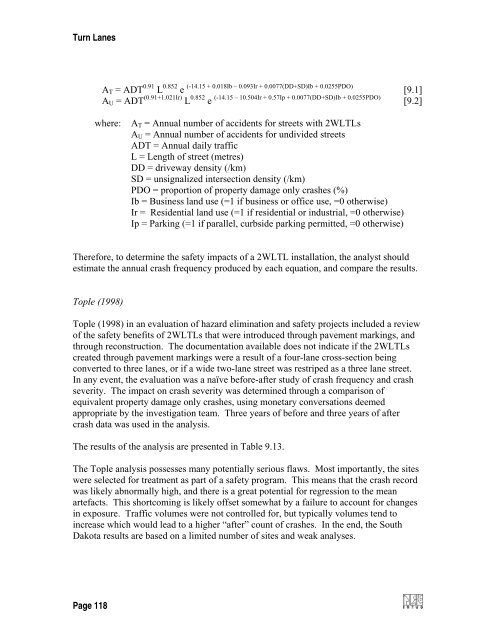
Turn Lanes<br />
A T = ADT 0.91 L 0.852 e (-14.15 + 0.018Ib – 0.093Ir + 0.0077(DD+SD)Ib + 0.0255PDO) [9.1]<br />
A U = ADT (0.91+1.021Ir) L 0.852 e (-14.15 – 10.504Ir + 0.57Ip + 0.0077(DD+SD)Ib + 0.0255PDO) [9.2]<br />
where:<br />
A T = Annual number <strong>of</strong> accidents <strong>for</strong> streets with 2WLTLs<br />
A U = Annual number <strong>of</strong> accidents <strong>for</strong> undivided streets<br />
ADT = Annual daily traffic<br />
L = Length <strong>of</strong> street (metres)<br />
DD = driveway density (/km)<br />
SD = unsignalized intersection density (/km)<br />
PDO = proportion <strong>of</strong> property damage only crashes (%)<br />
Ib = Business land use (=1 if business or <strong>of</strong>fice use, =0 otherwise)<br />
Ir = Residential land use (=1 if residential or industrial, =0 otherwise)<br />
Ip = Parking (=1 if parallel, curbside parking permitted, =0 otherwise)<br />
There<strong>for</strong>e, to determine the safety impacts <strong>of</strong> a 2WLTL installation, the analyst should<br />
estimate the annual crash frequency produced by each equation, and compare the results.<br />
Tople (1998)<br />
Tople (1998) in an evaluation <strong>of</strong> hazard elimination and safety projects included a review<br />
<strong>of</strong> the safety benefits <strong>of</strong> 2WLTLs that were introduced through pavement markings, and<br />
through reconstruction. The documentation available does not indicate if the 2WLTLs<br />
created through pavement markings were a result <strong>of</strong> a four-lane cross-section being<br />
converted to three lanes, or if a wide two-lane street was restriped as a three lane street.<br />
In any event, the evaluation was a naïve be<strong>for</strong>e-after study <strong>of</strong> crash frequency and crash<br />
severity. The impact on crash severity was determined through a comparison <strong>of</strong><br />
equivalent property damage only crashes, using monetary conversations deemed<br />
appropriate by the investigation team. Three years <strong>of</strong> be<strong>for</strong>e and three years <strong>of</strong> after<br />
crash data was used in the analysis.<br />
The results <strong>of</strong> the analysis are presented in Table 9.13.<br />
The Tople analysis possesses many potentially serious flaws. Most importantly, the sites<br />
were selected <strong>for</strong> treatment as part <strong>of</strong> a safety program. This means that the crash record<br />
was likely abnormally high, and there is a great potential <strong>for</strong> regression to the mean<br />
artefacts. This shortcoming is likely <strong>of</strong>fset somewhat by a failure to account <strong>for</strong> changes<br />
in exposure. <strong>Traffic</strong> volumes were not controlled <strong>for</strong>, but typically volumes tend to<br />
increase which would lead to a higher “after” count <strong>of</strong> crashes. In the end, the South<br />
Dakota results are based on a limited number <strong>of</strong> sites and weak analyses.<br />
Page 118


