

Synthesis of Safety for Traffic Operations - Transports Canada
Synthesis of Safety for Traffic Operations - Transports Canada
Synthesis of Safety for Traffic Operations - Transports Canada

Create successful ePaper yourself
Turn your PDF publications into a flip-book with our unique Google optimized e-Paper software.
<strong>Synthesis</strong> <strong>of</strong> <strong>Safety</strong> <strong>for</strong> <strong>Traffic</strong> <strong>Operations</strong> March 2003<br />
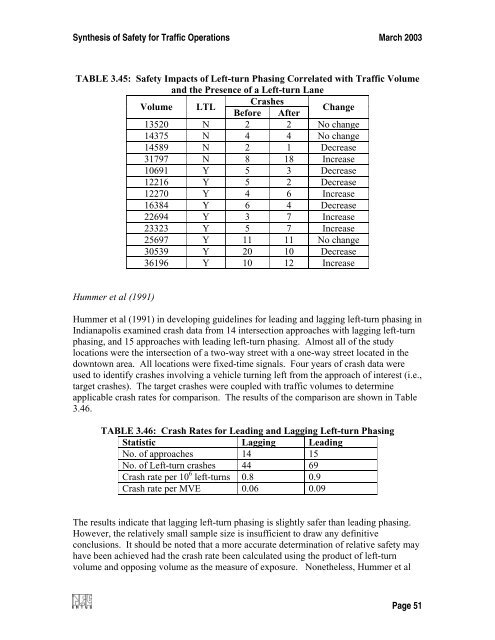
TABLE 3.45: <strong>Safety</strong> Impacts <strong>of</strong> Left-turn Phasing Correlated with <strong>Traffic</strong> Volume<br />
and the Presence <strong>of</strong> a Left-turn Lane<br />
Volume LTL<br />
Crashes<br />
Be<strong>for</strong>e After<br />
Change<br />
13520 N 2 2 No change<br />
14375 N 4 4 No change<br />
14589 N 2 1 Decrease<br />
31797 N 8 18 Increase<br />
10691 Y 5 3 Decrease<br />
12216 Y 5 2 Decrease<br />
12270 Y 4 6 Increase<br />
16384 Y 6 4 Decrease<br />
22694 Y 3 7 Increase<br />
23323 Y 5 7 Increase<br />
25697 Y 11 11 No change<br />
30539 Y 20 10 Decrease<br />
36196 Y 10 12 Increase<br />
Hummer et al (1991)<br />
Hummer et al (1991) in developing guidelines <strong>for</strong> leading and lagging left-turn phasing in<br />
Indianapolis examined crash data from 14 intersection approaches with lagging left-turn<br />
phasing, and 15 approaches with leading left-turn phasing. Almost all <strong>of</strong> the study<br />
locations were the intersection <strong>of</strong> a two-way street with a one-way street located in the<br />
downtown area. All locations were fixed-time signals. Four years <strong>of</strong> crash data were<br />
used to identify crashes involving a vehicle turning left from the approach <strong>of</strong> interest (i.e.,<br />
target crashes). The target crashes were coupled with traffic volumes to determine<br />
applicable crash rates <strong>for</strong> comparison. The results <strong>of</strong> the comparison are shown in Table<br />
3.46.<br />
TABLE 3.46: Crash Rates <strong>for</strong> Leading and Lagging Left-turn Phasing<br />
Statistic Lagging Leading<br />
No. <strong>of</strong> approaches 14 15<br />
No. <strong>of</strong> Left-turn crashes 44 69<br />
Crash rate per 10 6 left-turns 0.8 0.9<br />
Crash rate per MVE 0.06 0.09<br />
The results indicate that lagging left-turn phasing is slightly safer than leading phasing.<br />
However, the relatively small sample size is insufficient to draw any definitive<br />
conclusions. It should be noted that a more accurate determination <strong>of</strong> relative safety may<br />
have been achieved had the crash rate been calculated using the product <strong>of</strong> left-turn<br />
volume and opposing volume as the measure <strong>of</strong> exposure. Nonetheless, Hummer et al<br />
Page 51


