

Synthesis of Safety for Traffic Operations - Transports Canada
Synthesis of Safety for Traffic Operations - Transports Canada
Synthesis of Safety for Traffic Operations - Transports Canada

Create successful ePaper yourself
Turn your PDF publications into a flip-book with our unique Google optimized e-Paper software.
<strong>Synthesis</strong> <strong>of</strong> <strong>Safety</strong> <strong>for</strong> <strong>Traffic</strong> <strong>Operations</strong> March 2003<br />
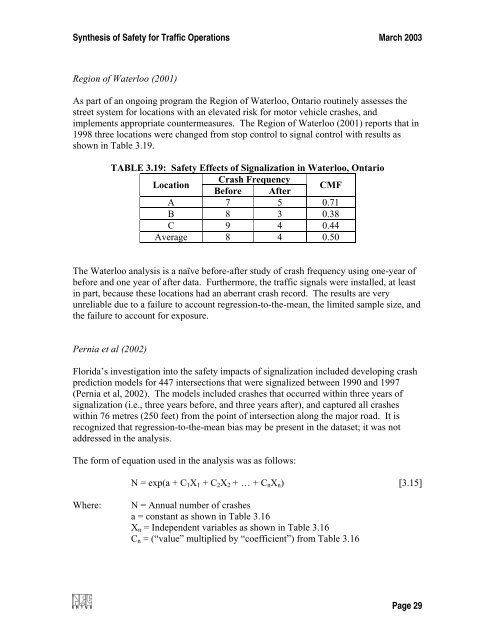
Region <strong>of</strong> Waterloo (2001)<br />
As part <strong>of</strong> an ongoing program the Region <strong>of</strong> Waterloo, Ontario routinely assesses the<br />
street system <strong>for</strong> locations with an elevated risk <strong>for</strong> motor vehicle crashes, and<br />
implements appropriate countermeasures. The Region <strong>of</strong> Waterloo (2001) reports that in<br />
1998 three locations were changed from stop control to signal control with results as<br />
shown in Table 3.19.<br />
TABLE 3.19: <strong>Safety</strong> Effects <strong>of</strong> Signalization in Waterloo, Ontario<br />
Location<br />
Crash Frequency<br />
Be<strong>for</strong>e After<br />
CMF<br />
A 7 5 0.71<br />
B 8 3 0.38<br />
C 9 4 0.44<br />
Average 8 4 0.50<br />
The Waterloo analysis is a naïve be<strong>for</strong>e-after study <strong>of</strong> crash frequency using one-year <strong>of</strong><br />
be<strong>for</strong>e and one year <strong>of</strong> after data. Furthermore, the traffic signals were installed, at least<br />
in part, because these locations had an aberrant crash record. The results are very<br />
unreliable due to a failure to account regression-to-the-mean, the limited sample size, and<br />
the failure to account <strong>for</strong> exposure.<br />
Pernia et al (2002)<br />
Florida’s investigation into the safety impacts <strong>of</strong> signalization included developing crash<br />
prediction models <strong>for</strong> 447 intersections that were signalized between 1990 and 1997<br />
(Pernia et al, 2002). The models included crashes that occurred within three years <strong>of</strong><br />
signalization (i.e., three years be<strong>for</strong>e, and three years after), and captured all crashes<br />
within 76 metres (250 feet) from the point <strong>of</strong> intersection along the major road. It is<br />
recognized that regression-to-the-mean bias may be present in the dataset; it was not<br />
addressed in the analysis.<br />
The <strong>for</strong>m <strong>of</strong> equation used in the analysis was as follows:<br />
N = exp(a + C 1 X 1 + C 2 X 2 + … + C n X n ) [3.15]<br />
Where:<br />
N = Annual number <strong>of</strong> crashes<br />
a = constant as shown in Table 3.16<br />
X n = Independent variables as shown in Table 3.16<br />
C n = (“value” multiplied by “coefficient”) from Table 3.16<br />
Page 29


