

Synthesis of Safety for Traffic Operations - Transports Canada
Synthesis of Safety for Traffic Operations - Transports Canada
Synthesis of Safety for Traffic Operations - Transports Canada

You also want an ePaper? Increase the reach of your titles
YUMPU automatically turns print PDFs into web optimized ePapers that Google loves.
<strong>Traffic</strong> Signs<br />
Only nine <strong>of</strong> the sites were treated with chevrons only, the remaining sites had<br />
complementary improvements including raised pavement markings, post mounted<br />
delineators, new or relocated traffic signs, pavement markings, etc.<br />
The evaluation methodology was a be<strong>for</strong>e-after analysis with some control <strong>for</strong> overall<br />
crash trends. The report indicates that an “expected” number <strong>of</strong> crashes is calculated by<br />
adjusting the “be<strong>for</strong>e” data with local crash trends. It is not specifically stated how this<br />
was done. The average “be<strong>for</strong>e” period <strong>for</strong> collision data was 5.3 years; the average<br />
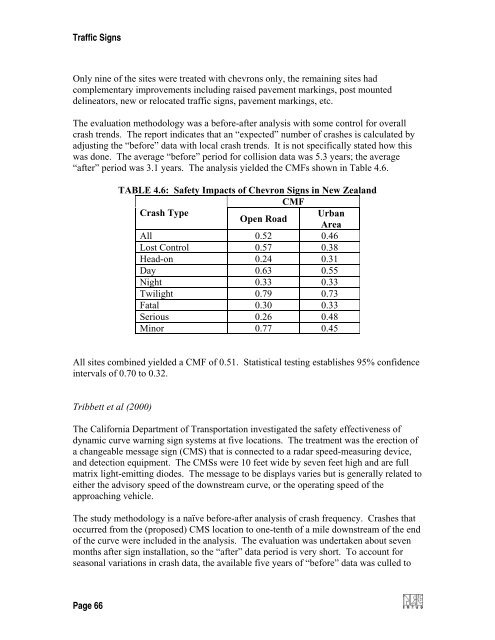
“after” period was 3.1 years. The analysis yielded the CMFs shown in Table 4.6.<br />
TABLE 4.6: <strong>Safety</strong> Impacts <strong>of</strong> Chevron Signs in New Zealand<br />
CMF<br />
Crash Type<br />
Urban<br />
Open Road<br />
Area<br />
All 0.52 0.46<br />
Lost Control 0.57 0.38<br />
Head-on 0.24 0.31<br />
Day 0.63 0.55<br />
Night 0.33 0.33<br />
Twilight 0.79 0.73<br />
Fatal 0.30 0.33<br />
Serious 0.26 0.48<br />
Minor 0.77 0.45<br />
All sites combined yielded a CMF <strong>of</strong> 0.51. Statistical testing establishes 95% confidence<br />
intervals <strong>of</strong> 0.70 to 0.32.<br />
Tribbett et al (2000)<br />
The Cali<strong>for</strong>nia Department <strong>of</strong> Transportation investigated the safety effectiveness <strong>of</strong><br />
dynamic curve warning sign systems at five locations. The treatment was the erection <strong>of</strong><br />
a changeable message sign (CMS) that is connected to a radar speed-measuring device,<br />
and detection equipment. The CMSs were 10 feet wide by seven feet high and are full<br />
matrix light-emitting diodes. The message to be displays varies but is generally related to<br />
either the advisory speed <strong>of</strong> the downstream curve, or the operating speed <strong>of</strong> the<br />
approaching vehicle.<br />
The study methodology is a naïve be<strong>for</strong>e-after analysis <strong>of</strong> crash frequency. Crashes that<br />
occurred from the (proposed) CMS location to one-tenth <strong>of</strong> a mile downstream <strong>of</strong> the end<br />
<strong>of</strong> the curve were included in the analysis. The evaluation was undertaken about seven<br />
months after sign installation, so the “after” data period is very short. To account <strong>for</strong><br />
seasonal variations in crash data, the available five years <strong>of</strong> “be<strong>for</strong>e” data was culled to<br />
Page 66


