

Synthesis of Safety for Traffic Operations - Transports Canada
Synthesis of Safety for Traffic Operations - Transports Canada
Synthesis of Safety for Traffic Operations - Transports Canada

Create successful ePaper yourself
Turn your PDF publications into a flip-book with our unique Google optimized e-Paper software.
Legislation and En<strong>for</strong>cement<br />
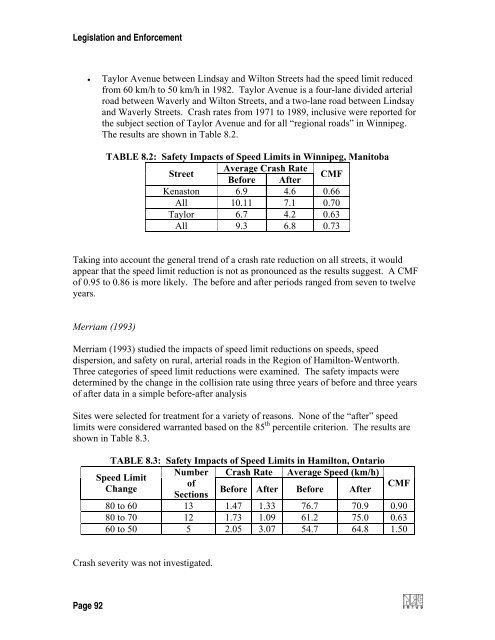
• Taylor Avenue between Lindsay and Wilton Streets had the speed limit reduced<br />
from 60 km/h to 50 km/h in 1982. Taylor Avenue is a four-lane divided arterial<br />
road between Waverly and Wilton Streets, and a two-lane road between Lindsay<br />
and Waverly Streets. Crash rates from 1971 to 1989, inclusive were reported <strong>for</strong><br />
the subject section <strong>of</strong> Taylor Avenue and <strong>for</strong> all “regional roads” in Winnipeg.<br />
The results are shown in Table 8.2.<br />
TABLE 8.2: <strong>Safety</strong> Impacts <strong>of</strong> Speed Limits in Winnipeg, Manitoba<br />
Street<br />
Average Crash Rate<br />
Be<strong>for</strong>e After<br />
CMF<br />
Kenaston 6.9 4.6 0.66<br />
All 10.11 7.1 0.70<br />
Taylor 6.7 4.2 0.63<br />
All 9.3 6.8 0.73<br />
Taking into account the general trend <strong>of</strong> a crash rate reduction on all streets, it would<br />
appear that the speed limit reduction is not as pronounced as the results suggest. A CMF<br />
<strong>of</strong> 0.95 to 0.86 is more likely. The be<strong>for</strong>e and after periods ranged from seven to twelve<br />
years.<br />
Merriam (1993)<br />
Merriam (1993) studied the impacts <strong>of</strong> speed limit reductions on speeds, speed<br />
dispersion, and safety on rural, arterial roads in the Region <strong>of</strong> Hamilton-Wentworth.<br />
Three categories <strong>of</strong> speed limit reductions were examined. The safety impacts were<br />
determined by the change in the collision rate using three years <strong>of</strong> be<strong>for</strong>e and three years<br />
<strong>of</strong> after data in a simple be<strong>for</strong>e-after analysis<br />
Sites were selected <strong>for</strong> treatment <strong>for</strong> a variety <strong>of</strong> reasons. None <strong>of</strong> the “after” speed<br />
limits were considered warranted based on the 85 th percentile criterion. The results are<br />
shown in Table 8.3.<br />
TABLE 8.3: <strong>Safety</strong> Impacts <strong>of</strong> Speed Limits in Hamilton, Ontario<br />
Number Crash Rate Average Speed (km/h)<br />
Speed Limit<br />
<strong>of</strong><br />
Change<br />
Be<strong>for</strong>e After Be<strong>for</strong>e After<br />
Sections<br />
CMF<br />
80 to 60 13 1.47 1.33 76.7 70.9 0.90<br />
80 to 70 12 1.73 1.09 61.2 75.0 0.63<br />
60 to 50 5 2.05 3.07 54.7 64.8 1.50<br />
Crash severity was not investigated.<br />
Page 92


