

Synthesis of Safety for Traffic Operations - Transports Canada
Synthesis of Safety for Traffic Operations - Transports Canada
Synthesis of Safety for Traffic Operations - Transports Canada

You also want an ePaper? Increase the reach of your titles
YUMPU automatically turns print PDFs into web optimized ePapers that Google loves.
<strong>Synthesis</strong> <strong>of</strong> <strong>Safety</strong> <strong>for</strong> <strong>Traffic</strong> <strong>Operations</strong> March 2003<br />
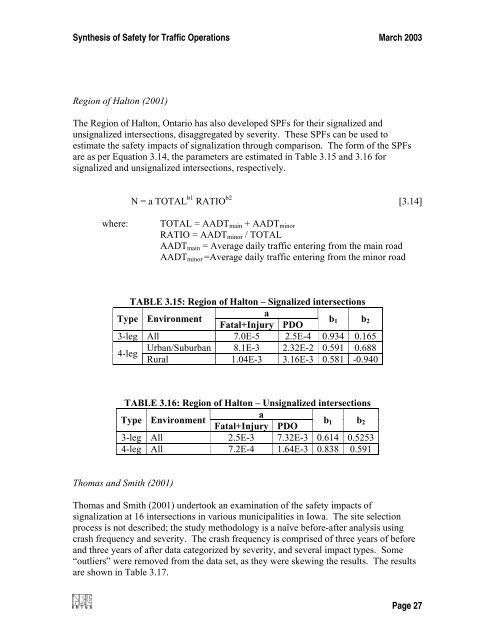
Region <strong>of</strong> Halton (2001)<br />
The Region <strong>of</strong> Halton, Ontario has also developed SPFs <strong>for</strong> their signalized and<br />
unsignalized intersections, disaggregated by severity. These SPFs can be used to<br />
estimate the safety impacts <strong>of</strong> signalization through comparison. The <strong>for</strong>m <strong>of</strong> the SPFs<br />
are as per Equation 3.14, the parameters are estimated in Table 3.15 and 3.16 <strong>for</strong><br />
signalized and unsignalized intersections, respectively.<br />
N = a TOTAL b1 RATIO b2 [3.14]<br />
where:<br />
TOTAL = AADT main + AADT minor<br />
RATIO = AADT minor / TOTAL<br />
AADT main = Average daily traffic entering from the main road<br />
AADT minor =Average daily traffic entering from the minor road<br />
TABLE 3.15: Region <strong>of</strong> Halton – Signalized intersections<br />
a<br />
Type Environment<br />
b<br />
Fatal+Injury PDO 1 b 2<br />
3-leg All 7.0E-5 2.5E-4 0.934 0.165<br />
Urban/Suburban 8.1E-3 2.32E-2 0.591 0.688<br />
4-leg<br />
Rural 1.04E-3 3.16E-3 0.581 -0.940<br />
TABLE 3.16: Region <strong>of</strong> Halton – Unsignalized intersections<br />
Type Environment<br />
a<br />
Fatal+Injury PDO<br />
b 1 b 2<br />
3-leg All 2.5E-3 7.32E-3 0.614 0.5253<br />
4-leg All 7.2E-4 1.64E-3 0.838 0.591<br />
Thomas and Smith (2001)<br />
Thomas and Smith (2001) undertook an examination <strong>of</strong> the safety impacts <strong>of</strong><br />
signalization at 16 intersections in various municipalities in Iowa. The site selection<br />
process is not described; the study methodology is a naïve be<strong>for</strong>e-after analysis using<br />
crash frequency and severity. The crash frequency is comprised <strong>of</strong> three years <strong>of</strong> be<strong>for</strong>e<br />
and three years <strong>of</strong> after data categorized by severity, and several impact types. Some<br />
“outliers” were removed from the data set, as they were skewing the results. The results<br />
are shown in Table 3.17.<br />
Page 27


