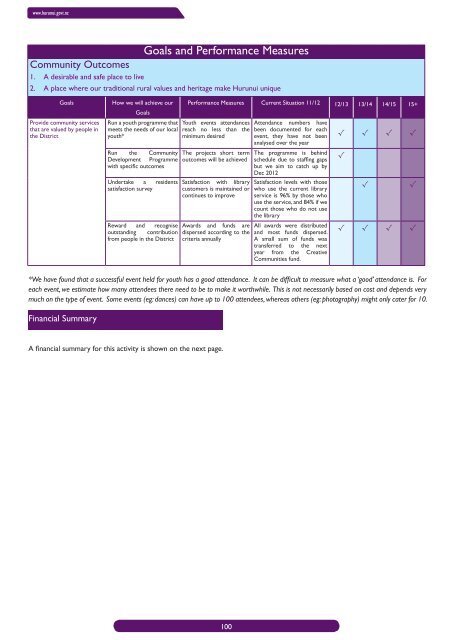
www.hurunui.govt.nz Goals and Performance Measures <strong>Community</strong> Outcomes 1. A desirable and safe place to live 2. A place where our traditional rural values and heritage make <strong>Hurunui</strong> unique Goals Provide community services that are valued by people in the <strong>District</strong> How we will achieve our Goals Run a youth programme that meets the needs of our local youth* Run the <strong>Community</strong> Development Programme with specific outcomes Undertake a residents satisfaction survey Reward and recognise outstanding contribution from people in the <strong>District</strong> Performance Measures Current Situation 11/12 12/13 13/14 14/15 15+ Youth events attendances reach no less than the minimum desired The projects short term outcomes will be achieved Satisfaction with library customers is maintained or continues to improve Awards and funds are dispersed according to the criteria annually Attendance numbers have been documented for each event, they have not been analysed over the year The programme is behind schedule due to staffing gaps but we aim to catch up by Dec <strong>2012</strong> Satisfaction levels with those who use the current library service is 96% by those who use the service, and 84% if we count those who do not use the library All awards were distributed and most funds dispersed. A small sum of funds was transferred to the next year from the Creative Communities fund. √ √ √ √ √ √ √ √ √ √ √ *We have found that a successful event held for youth has a good attendance. It can be difficult to measure what a ‘good’ attendance is. For each event, we estimate how many attendees there need to be to make it worthwhile. This is not necessarily based on cost and depends very much on the type of event. Some events (eg: dances) can have up to 100 attendees, whereas others (eg: photography) might only cater for 10. Financial Summary A financial summary for this activity is shown on the next page. 100
<strong>Hurunui</strong> <strong>Community</strong> <strong>Long</strong> <strong>Term</strong> <strong>Plan</strong> <strong>2012</strong> - <strong>2022</strong> <strong>Community</strong> Services - Activity Financial Summary Annual <strong>Plan</strong> Year 1 Year 2 Year 3 Year 4 Year 5 Year 6 Year 7 Year 8 Year 9 Year 10 2011/<strong>2012</strong> <strong>2012</strong>/2013 2013/2014 2014/2015 2015/2016 2016/2017 2017/2018 2018/2019 2019/2020 2020/2021 2021/<strong>2022</strong> Operating Statement Operating Revenue <strong>District</strong> Wide Rates 111,231 125,256 183,171 245,584 207,940 164,669 171,323 178,239 186,694 193,770 202,051 Targeted Rates 1,322,703 659,430 690,448 690,512 712,141 750,247 759,789 804,281 830,932 859,808 899,290 Other Income 152,809 171,950 94,828 97,715 100,814 104,133 107,094 110,119 113,604 117,429 121,273 Internal Interest Received 1,577 282 772 1,441 1,924 2,381 3,167 4,256 5,678 7,210 8,191 Development Contributions 40,698 37,854 38,777 40,624 30,798 0 0 0 0 0 0 Total Operating Revenue 1,629,018 994,772 1,007,996 1,075,878 1,053,617 1,021,430 1,041,373 1,096,896 1,136,908 1,178,217 1,230,804 Operating Expenditure Employee Benefits 481,512 559,940 494,474 509,529 525,687 542,996 558,434 574,209 592,381 612,326 632,368 Direct Operating Expenditure 317,643 340,680 394,078 459,864 429,735 395,907 406,697 420,157 437,672 451,487 468,077 Internal Interest Paid 181,808 139,671 140,484 137,711 144,326 175,475 171,652 169,787 166,044 165,085 156,667 <strong>Council</strong> Overheads Expenditure 443,281 502,662 513,161 529,880 537,137 550,357 562,698 574,570 594,306 605,220 620,842 Depreciation 118,136 109,842 109,842 112,344 112,444 112,444 114,121 114,121 114,121 116,611 116,611 Total Operating Expenditure 1,542,380 1,652,796 1,652,039 1,749,328 1,749,329 1,777,179 1,813,602 1,852,844 1,904,523 1,950,729 1,994,565 Operating Surplus (Deficit) 86,638 (658,024) (644,043) (673,451) (695,712) (755,749) (772,229) (755,948) (767,615) (772,512) (763,761) Capital Statement Capital Expenditure Library 92,654 65,000 67,548 69,797 72,196 74,796 77,643 80,789 84,234 88,082 92,131 Total Capital Expenditure 92,654 65,000 67,548 69,797 72,196 74,796 77,643 80,789 84,234 88,082 92,131 Funds Required Operating Deficit 0 658,024 644,043 673,451 695,712 755,749 772,229 755,948 767,615 772,512 763,761 Capital Expenditure 92,654 65,000 67,548 69,797 72,196 74,796 77,643 80,789 84,234 88,082 92,131 Transfer to General <strong>Council</strong> Reserves 72,953 72,953 72,953 72,953 72,953 72,953 72,953 72,953 72,953 72,953 72,953 Repayment of Internal Loans from Operating Income 956,180 162,794 184,904 176,509 172,428 132,823 136,712 171,372 182,237 203,973 236,812 1,121,787 958,771 969,448 992,710 1,013,288 1,036,320 1,059,536 1,081,062 1,107,038 1,137,520 1,165,656 Funded by Operating Surplus 86,638 0 0 0 0 0 0 0 0 0 0 Transfer from Hanmer Springs Thermal Reserve 824,359 770,644 792,057 810,569 828,649 849,081 867,773 886,153 908,684 932,827 956,914 Non Cash Expenditure - Depreciation 118,136 109,842 109,842 112,344 112,444 112,444 114,121 114,121 114,121 116,611 116,611 Transfer from General <strong>Council</strong> Reserves 92,654 78,285 67,548 69,797 72,196 74,796 77,643 80,789 84,234 88,082 92,131 1,121,787 958,771 969,448 992,710 1,013,288 1,036,320 1,059,536 1,081,062 1,107,038 1,137,520 1,165,656 H:\<strong>Long</strong> <strong>Term</strong> <strong>Plan</strong> Workings\<strong>Hurunui</strong> <strong>District</strong> <strong>Council</strong> LTP Budgets <strong>2012</strong>-<strong>2022</strong> - Post Submissions.xls 31/05/<strong>2012</strong> 9:34 a.m. 101