Long Term Community Plan 2012-2022 - Hurunui District Council
Long Term Community Plan 2012-2022 - Hurunui District Council
Long Term Community Plan 2012-2022 - Hurunui District Council

You also want an ePaper? Increase the reach of your titles
YUMPU automatically turns print PDFs into web optimized ePapers that Google loves.
<strong>Hurunui</strong> <strong>Community</strong> <strong>Long</strong> <strong>Term</strong> <strong>Plan</strong> <strong>2012</strong> - <strong>2022</strong><br />
years of the <strong>Long</strong> <strong>Term</strong> <strong>Plan</strong>, the <strong>Council</strong> will record small<br />
operating deficits. These will be funded by existing reserves<br />
built up by surpluses generated by the Hanmer Springs Thermal<br />
Pools & Spa in the past.<br />
Operating Expenditure – Total Operating Expenditure is<br />
expected to be $351 million over the ten years. The total<br />
increase from the 2011/<strong>2012</strong> year is expected to be 38% over<br />
the ten years and average of less than 4% per annum.<br />
Capital Expenditure – Over the ten year period, we are<br />
forecasting to spend a total of $77 million on Capital<br />
Expenditure. $6.3 million is scheduled to fund projects required<br />
due to growth, further $14.7 million relates to projects that will<br />
assist in improving the levels of services we provide and the<br />
remaining $56.2 million will be used to replace existing assets<br />
when they reach the end of their useful lives.<br />
This information is particularly relevant in determining<br />
growth projections for the period and was also used for the<br />
Development Contributions methodology. We have opted for<br />
the medium growth projections for the ten year period. On this<br />
basis, we have assumed that there will be approximately 17%<br />
growth over the ten year period. The increase predicted for<br />
Hanmer Springs is approximately 21%. With Hanmer Springs<br />
being a tourist town, the growth in new sections and buildings is<br />
not always consistent with an increase in population due to the<br />
higher percentage of non-resident ratepayers who may own a<br />
holiday home rather than a permanent residence.<br />
The following graph shows the movements in the population<br />
of each township in the <strong>District</strong> over the period from 1991 to<br />
2006:<br />
External Debt – This is scheduled to increase from the $13.5<br />
as schedule in the 2011/<strong>2012</strong> Annual <strong>Plan</strong> to reach a maximum<br />
of $22.5 million in the between July 2015 and June 2017. With<br />
communities required to repay certain levels of debt each year<br />
and some communities starting to build up funds to carry out<br />
capital expenditure in the future, we are forecasting that the<br />
external debt will reduce to $12 million by the end of June <strong>2022</strong>.<br />
Internal Debt – With communities repaying debt and building<br />
up funds, the movements in the internal debt levels move from<br />
$16.6 million in <strong>2012</strong> down to $15 million in <strong>2022</strong>.<br />
Assets – It is expected that the value of our assets will be $493<br />
million as at 30 June <strong>2022</strong>. This increase of $165 million has been<br />
brought about by the level of Capital expenditure to be incurred<br />
over the ten years, but also due to the fact that the assets are<br />
required to be revalued on a regular basis. It is forecast that the<br />
increase in the asset values will account for $147 million of the<br />
increase over the ten years.<br />
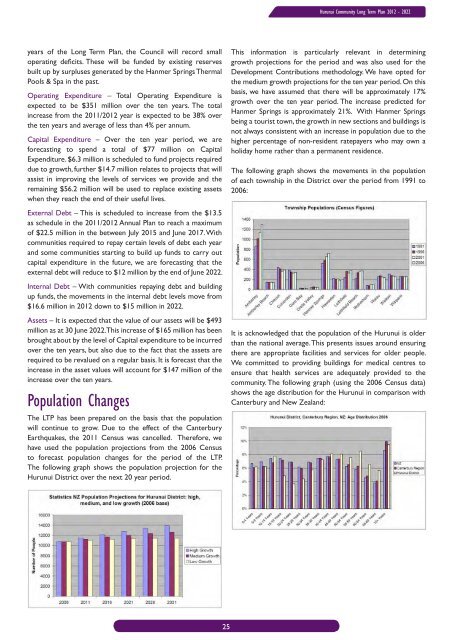
Population Changes<br />
The LTP has been prepared on the basis that the population<br />
will continue to grow. Due to the effect of the Canterbury<br />
Earthquakes, the 2011 Census was cancelled. Therefore, we<br />
have used the population projections from the 2006 Census<br />
to forecast population changes for the period of the LTP.<br />
The following graph shows the population projection for the<br />
<strong>Hurunui</strong> <strong>District</strong> over the next 20 year period.<br />
It is acknowledged that the population of the <strong>Hurunui</strong> is older<br />
than the national average. This presents issues around ensuring<br />
there are appropriate facilities and services for older people.<br />
We committed to providing buildings for medical centres to<br />
ensure that health services are adequately provided to the<br />
community. The following graph (using the 2006 Census data)<br />
shows the age distribution for the <strong>Hurunui</strong> in comparison with<br />
Canterbury and New Zealand:<br />
25