Long Term Community Plan 2012-2022 - Hurunui District Council
Long Term Community Plan 2012-2022 - Hurunui District Council
Long Term Community Plan 2012-2022 - Hurunui District Council

You also want an ePaper? Increase the reach of your titles
YUMPU automatically turns print PDFs into web optimized ePapers that Google loves.
www.hurunui.govt.nz<br />
Forecasting Assumptions<br />
1. Inflation<br />
In preparing the LTP, the <strong>Council</strong> is required to use best<br />
estimates in determining the level of costs to be budgeted in<br />
the future. As a result, the <strong>Council</strong> is required to account for<br />
the effect of price changes or inflation that is expected to occur<br />
over the ten year period.<br />
To develop a consistent approach for local government to<br />
account for inflation, the Society of Local Government Managers<br />
(SOLGM) contracted Business and Economic Research Limited<br />
(BERL) to construct forecasts for inflation.<br />
The <strong>Hurunui</strong> <strong>District</strong> <strong>Council</strong> has endorsed the Local<br />
Government Cost Index (LGCI) rates produced by BERL and<br />
have used these rates as the assumption for accounting for<br />
inflation in the preparation of the LTP. In applying the rates, the<br />
<strong>Council</strong> has adopted the split between Operating Expenditure<br />
(Opex) and Capital Expenditure (Capex) as allowed for in<br />
BERL’s analysis.<br />
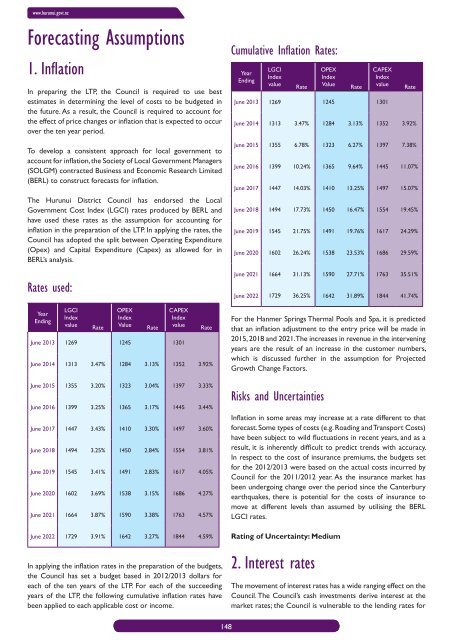
Rates used:<br />
Year<br />
Ending<br />
LGCI<br />
Index<br />
value<br />
Rate<br />
OPEX<br />
Index<br />
Value<br />
Rate<br />
CAPEX<br />
Index<br />
value<br />
June 2013 1269 1245 1301<br />
Rate<br />
June 2014 1313 3.47% 1284 3.13% 1352 3.92%<br />
June 2015 1355 3.20% 1323 3.04% 1397 3.33%<br />
June 2016 1399 3.25% 1365 3.17% 1445 3.44%<br />
June 2017 1447 3.43% 1410 3.30% 1497 3.60%<br />
June 2018 1494 3.25% 1450 2.84% 1554 3.81%<br />
June 2019 1545 3.41% 1491 2.83% 1617 4.05%<br />
June 2020 1602 3.69% 1538 3.15% 1686 4.27%<br />
June 2021 1664 3.87% 1590 3.38% 1763 4.57%<br />
June <strong>2022</strong> 1729 3.91% 1642 3.27% 1844 4.59%<br />
In applying the inflation rates in the preparation of the budgets,<br />
the <strong>Council</strong> has set a budget based in <strong>2012</strong>/2013 dollars for<br />
each of the ten years of the LTP. For each of the succeeding<br />
years of the LTP, the following cumulative inflation rates have<br />
been applied to each applicable cost or income.<br />
Cumulative Inflation Rates:<br />
Year<br />
Ending<br />
LGCI<br />
Index<br />
value<br />
Rate<br />
OPEX<br />
Index<br />
Value<br />
Rate<br />
CAPEX<br />
Index<br />
value<br />
June 2013 1269 1245 1301<br />
Rate<br />
June 2014 1313 3.47% 1284 3.13% 1352 3.92%<br />
June 2015 1355 6.78% 1323 6.27% 1397 7.38%<br />
June 2016 1399 10.24% 1365 9.64% 1445 11.07%<br />
June 2017 1447 14.03% 1410 13.25% 1497 15.07%<br />
June 2018 1494 17.73% 1450 16.47% 1554 19.45%<br />
June 2019 1545 21.75% 1491 19.76% 1617 24.29%<br />
June 2020 1602 26.24% 1538 23.53% 1686 29.59%<br />
June 2021 1664 31.13% 1590 27.71% 1763 35.51%<br />
June <strong>2022</strong> 1729 36.25% 1642 31.89% 1844 41.74%<br />
For the Hanmer Springs Thermal Pools and Spa, it is predicted<br />
that an inflation adjustment to the entry price will be made in<br />
2015, 2018 and 2021. The increases in revenue in the intervening<br />
years are the result of an increase in the customer numbers,<br />
which is discussed further in the assumption for Projected<br />
Growth Change Factors.<br />
Risks and Uncertainties<br />
Inflation in some areas may increase at a rate different to that<br />
forecast. Some types of costs (e.g. Roading and Transport Costs)<br />
have been subject to wild fluctuations in recent years, and as a<br />
result, it is inherently difficult to predict trends with accuracy.<br />
In respect to the cost of insurance premiums, the budgets set<br />
for the <strong>2012</strong>/2013 were based on the actual costs incurred by<br />
<strong>Council</strong> for the 2011/<strong>2012</strong> year. As the insurance market has<br />
been undergoing change over the period since the Canterbury<br />
earthquakes, there is potential for the costs of insurance to<br />
move at different levels than assumed by utilising the BERL<br />
LGCI rates.<br />
Rating of Uncertainty: Medium<br />
2. Interest rates<br />
The movement of interest rates has a wide ranging effect on the<br />
<strong>Council</strong>. The <strong>Council</strong>’s cash investments derive interest at the<br />
market rates; the <strong>Council</strong> is vulnerable to the lending rates for<br />
148