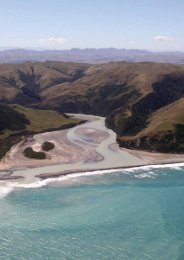
www.hurunui.govt.nz <strong>Community</strong> Outcomes 1. A desirable and safe place to live 2. A place with essential infrastructure Goals and Performance Measures Goals How we will achieve our Goals Maintain the Contract out road district’s roads to a maintenance and monitor performance standard appropriate accordingly to their use Ensure that all bridges are safe and well maintained Undertake a residents satisfaction survey Contract out bridge maintenance and monitor performance accordingly Performance Measures Current Situation 11/12 12/13 13/14 14/15 15+ <strong>Hurunui</strong> roads will compare favourably with the national rural road averages using the measures shown below: The smoothness of our roads The roughness of our roads The strength of our roads Residents consider the overall standard of road maintenance to be satisfactory (more than 70%) Replace priority bridge structures according to the bridge replacement programme Overall, our roads compared better than the national average as shown below: Overall, our roads compare better than the national average as shown below: Smooth travel exposure – <strong>Hurunui</strong>’s roading network is 97%. The national average is 86% (a higher value is better) Overall, our roads compare better than the national average as shown below: Percentage rough roads in the <strong>Hurunui</strong> is 4.2%. The national average is 9.1% (a lower value is better) Overall, our roads compare better than the national average as shown below: The strength of our roads is measured by a pavement Integrety Index (PII). The PII for the <strong>Hurunui</strong> is 96.6% The national average is 93.7% (a higher value is better) Resident satisfaction levels have improved since 2007. In 2011 they were 73% satisfied Bridge repairs have commenced after a bridge structural component replacement programme was identified √ √ √ √ √ √ √ √ √ √ √ √ √ √ √ √ √ √ Financial Summary A financial summary for this activity is shown on the next page. Happy Valley Road, Emergency Preventative Maintenance 88
Roading and Footpaths - Group Activity Financial Summary Annual <strong>Plan</strong> Year 1 Year 2 Year 3 Year 4 Year 5 Year 6 Year 7 Year 8 Year 9 Year 10 2011/<strong>2012</strong> <strong>2012</strong>/2013 2013/2014 2014/2015 2015/2016 2016/2017 2017/2018 2018/2019 2019/2020 2020/2021 2021/<strong>2022</strong> Operating Statement Operating Revenue <strong>District</strong> Wide Rates 2,530,693 3,330,774 3,448,061 3,581,566 3,676,230 3,803,429 3,954,195 4,065,093 4,217,827 4,410,833 4,557,402 Targeted Rates 0 181,043 182,746 183,293 189,419 196,059 215,275 217,578 220,162 224,947 235,288 Other Income 3,681,103 3,417,324 3,537,973 3,650,457 3,771,539 3,901,663 4,031,387 4,171,048 4,326,697 4,498,895 4,677,661 Internal Interest Received 730,877 0 0 0 0 0 0 0 0 0 0 Development Contributions 452,926 152,662 158,646 163,928 169,561 237,230 246,260 256,238 267,165 279,370 232,563 Total Operating Revenue 7,395,599 7,081,803 7,327,426 7,579,245 7,806,748 8,138,381 8,447,116 8,709,957 9,031,851 9,414,044 9,702,914 Operating Expenditure Direct Operating Expenditure 2,783,808 2,835,517 2,923,593 3,034,095 3,106,987 3,208,862 3,323,755 3,393,032 3,500,804 3,644,415 3,736,813 Internal Interest Paid 2,779 2,162 1,953 1,729 1,489 1,231 955 659 341 0 0 <strong>Council</strong> Overheads Expenditure 621,618 597,985 617,912 638,714 659,260 682,123 702,541 723,397 748,335 773,703 800,141 Depreciation 2,900,000 2,863,125 3,182,179 3,191,330 3,202,063 3,557,671 3,568,108 3,580,853 4,009,038 4,020,758 4,035,406 Total Operating Expenditure 6,308,205 6,298,789 6,725,637 6,865,869 6,969,798 7,449,888 7,595,359 7,697,941 8,258,518 8,438,876 8,572,360 Operating Surplus (Deficit) 1,087,394 783,013 601,789 713,376 836,950 688,493 851,757 1,012,016 773,333 975,169 1,130,554 Capital Statement Capital Expenditure Subsidised Roading 3,915,811 3,426,258 3,560,567 3,679,116 3,805,544 4,004,157 4,156,571 4,324,991 4,509,418 4,715,420 4,872,558 Special Purpose Roading 10,708 16,000 16,627 17,181 17,771 18,411 19,112 19,886 20,734 21,682 22,678 Unsubsidised Roading 26,526 25,000 25,980 26,845 27,768 28,768 29,863 31,073 32,398 33,878 35,435 Amberley Ward Roadside Construction 42,440 33,000 29,098 24,697 25,546 26,466 39,419 34,801 29,806 31,167 32,600 Amuri Ward Roadside Construction 50,243 22,000 22,862 23,624 24,435 25,315 26,279 27,344 28,510 29,812 31,183 Cheviot Ward Roadside Construction 25,625 30,000 31,176 32,214 33,321 34,521 35,835 37,287 38,877 40,653 42,522 Hanmer Springs Ward Roadside Construction 85,000 75,000 77,940 80,535 83,303 86,303 89,588 93,218 97,193 101,633 106,305 <strong>Hurunui</strong> Ward Roadside Construction 16,000 16,000 16,627 17,181 17,771 18,411 19,112 19,886 20,734 21,682 22,678 Total Capital Expenditure 4,172,353 3,643,258 3,780,878 3,901,392 4,035,459 4,242,352 4,415,777 4,588,486 4,777,670 4,995,926 5,165,960 Funds Required Capital Expenditure 4,172,353 3,643,258 3,780,878 3,901,392 4,035,459 4,242,352 4,415,777 4,588,486 4,777,670 4,995,926 5,165,960 Repayment of Internal Loans from Operating Income 0 2,880 3,090 3,314 3,553 3,811 4,088 4,384 4,702 0 0 4,172,353 3,646,139 3,783,967 3,904,706 4,039,013 4,246,164 4,419,865 4,592,869 4,782,371 4,995,926 5,165,960 <strong>Hurunui</strong> <strong>Community</strong> <strong>Long</strong> <strong>Term</strong> <strong>Plan</strong> <strong>2012</strong> - <strong>2022</strong> Funded by Operating Surplus 1,087,394 783,013 601,789 713,376 836,950 688,493 851,757 1,012,016 773,333 975,169 1,130,554 Non Cash Expenditure - Depreciation 2,900,000 2,863,125 3,182,179 3,191,330 3,202,063 3,557,671 3,568,108 3,580,853 4,009,038 4,020,758 4,035,406 Capital Expenditure funded through Internal Loans 219,308 0 0 0 0 0 0 0 0 0 0 4,206,702 3,646,139 3,783,967 3,904,706 4,039,013 4,246,164 4,419,865 4,592,869 4,782,371 4,995,926 5,165,960 C:\Users\jab\Desktop\Fuck Up with Subsidised Roading\<strong>Hurunui</strong> <strong>District</strong> <strong>Council</strong> LTP Budgets <strong>2012</strong>-<strong>2022</strong> - Post Submissions - with Option 2 for Subsidised Roading.xls 27/06/<strong>2012</strong> 2:31 p.m. 89