Long Term Community Plan 2012-2022 - Hurunui District Council
Long Term Community Plan 2012-2022 - Hurunui District Council
Long Term Community Plan 2012-2022 - Hurunui District Council

Create successful ePaper yourself
Turn your PDF publications into a flip-book with our unique Google optimized e-Paper software.
www.hurunui.govt.nz<br />
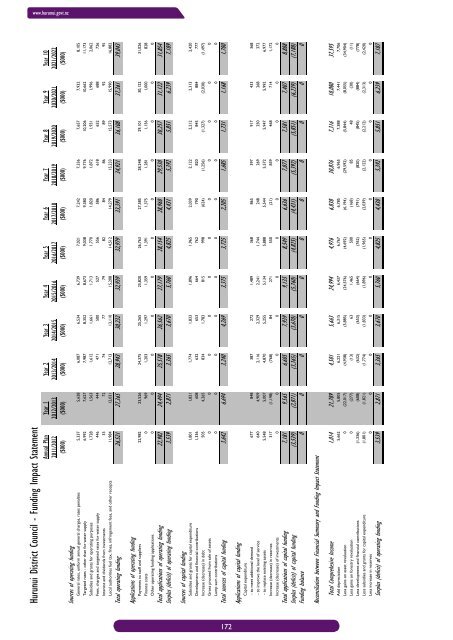
<strong>Hurunui</strong> <strong>District</strong> <strong>Council</strong> - Funding Impact Statement<br />
Annual <strong>Plan</strong> Year 1 Year 2 Year 3 Year 4 Year 5 Year 6 Year 7 Year 8 Year 9 Year 10<br />
2011/<strong>2012</strong> <strong>2012</strong>/2013 2013/2014 2014/2015 2015/2016 2016/2017 2017/2018 2018/2019 2019/2020 2020/2021 2021/<strong>2022</strong><br />
($000) ($000) ($000) ($000) ($000) ($000) ($000) ($000) ($000) ($000) ($000)<br />
Sources of operating funding<br />
General rates, uniform annual general charges, rates penalties 5,337 5,628 6,087 6,534 6,739 7,021 7,242 7,336 7,657 7,932 8,105<br />
Targeted rates - other than for water supply 6,992 7,627 7,987 8,352 8,673 9,038 9,380 9,776 10,206 10,662 11,173<br />
Subsidies and grants for operating purposes 1,728 1,563 1,612 1,661 1,713 1,770 1,820 1,872 1,931 1,996 2,062<br />
Fees, charges and targeted rates for water supply 446 444 471 500 527 556 586 618 652 688 726<br />
Interest and dividends from investments 33 72 74 77 79 82 84 86 89 92 95<br />
Local authorities fuel tax, fines, infringement fees, and other receipts 11,984 12,031 12,713 13,110 15,208 14,512 14,279 15,233 15,573 15,990 16,882<br />
Total operating funding 26,521 27,365 28,943 30,232 32,939 32,979 33,391 34,921 36,108 37,361 39,043<br />
Applications of operating funding<br />
Payments to staff and suppliers 22,982 23,526 24,375 25,265 25,820 26,763 27,585 28,248 29,101 30,122 31,026<br />
Finance costs 0 969 1,203 1,297 1,359 1,391 1,375 1,281 1,156 1,000 828<br />
Other operating funding applications 0 0 0 0 0 0 0 0 0 0 0<br />
Total applications of operating funding 22,982 24,494 25,578 26,562 27,179 28,154 28,960 29,530 30,257 31,122 31,854<br />
Surplus (deficit) of operating funding 3,539 2,871 3,365 3,670 5,760 4,825 4,431 5,392 5,851 6,239 7,189<br />
Sources of capital funding<br />
Subsidies and grants for capital expenditure 1,801 1,821 1,774 1,833 1,896 1,965 2,039 2,122 2,212 2,313 2,420<br />
Development and financial contributions 1,336 608 632 653 664 762 790 820 845 884 777<br />
Increase (decrease) in debt 505 4,265 834 1,783 815 998 (624) (1,256) (1,327) (2,030) (1,497)<br />
Gross proceed from sale of assets 0 0 0 0 0 0 0 0 0 0 0<br />
Lump sum contributions 0 0 0 0 0 0 0 0 0 0 0<br />
Total sources of capital funding 3,642 6,694 3,240 4,269 3,375 3,725 2,205 1,685 1,731 1,168 1,700<br />
Applications of capital funding<br />
Capital expenditure<br />
- to meet additional demand 677 848 387 272 1,489 368 865 397 917 433 368<br />
- to improve the level of service 640 4,909 2,116 2,329 2,241 1,744 248 269 250 268 372<br />
- to replace existing assets 5,548 5,007 4,870 5,255 5,134 5,888 5,544 5,572 5,947 5,992 6,977<br />
Increase (decrease) in reserves 317 (1,198) (768) 84 271 550 (21) 839 468 714 1,172<br />
Increase (decrease) of investments 0 0 0 0 0 0 0 0 0 0 0<br />
Total applications of capital funding 7,181 9,565 6,605 7,939 9,135 8,549 6,636 7,077 7,581 7,407 8,888<br />
Surplus (deficit) of capital funding (3,539) (2,871) (3,365) (3,670) (5,760) (4,825) (4,431) (5,392) (5,851) (6,239) (7,188)<br />
Funding balance 0 0 0 0 0 0 0 0 0 0 0<br />
Reconciliation between Financial Summary and Funding Impact Statement<br />
Total Comprehesive Income 1,014 21,789 4,501 5,663 24,994 4,976 6,838 30,876 7,316 10,080 37,595<br />
Add depreciation 5,662 5,805 6,221 6,315 6,437 6,767 6,785 6,965 7,388 7,441 7,706<br />
Less gains on asset revaluation 0 (22,017) (4,938) (5,885) (24,576) (4,692) (6,194) (29,592) (5,844) (8,055) (34,904)<br />
Less gains on forestry revaluation 0 (277) (13) 63 1,465 500 (168) 85 48 (30) (11)<br />
Less development and financial contributions (1,336) (608) (632) (653) (664) (762) (791) (820) (845) (884) (778)<br />
Less subsidies and grants for capital expenditure (1,801) (1,821) (1,774) (1,833) (1,896) (1,965) (2,039) (2,122) (2,212) (2,313) (2,420)<br />
Less increase in reserves 0 0 0 0 0 0 0 0 0 0 0<br />
Surplus (deficit) of operating funding 3,539 2,871 3,365 3,670 5,760 4,825 4,430 5,392 5,851 6,239 7,187<br />
C:\Users\jab\Desktop\Fuck Up with Subsidised Roading\<strong>Hurunui</strong> <strong>District</strong> <strong>Council</strong> LTP Budgets <strong>2012</strong>-<strong>2022</strong> - Post Submissions - with Option 2 for Subsidised Roading.xls 27/06/<strong>2012</strong> 2:38 p.m.<br />
172