Long Term Community Plan 2012-2022 - Hurunui District Council
Long Term Community Plan 2012-2022 - Hurunui District Council
Long Term Community Plan 2012-2022 - Hurunui District Council

Create successful ePaper yourself
Turn your PDF publications into a flip-book with our unique Google optimized e-Paper software.
www.hurunui.govt.nz<br />
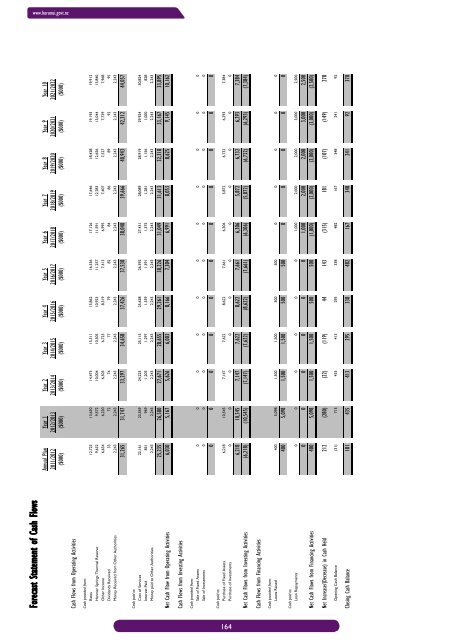
Forecast Statement of Cash Flows<br />
Annual <strong>Plan</strong> Year 1 Year 2 Year 3 Year 4 Year 5 Year 6 Year 7 Year 8 Year 9 Year 10<br />
2011/<strong>2012</strong> <strong>2012</strong>/2013 2013/2014 2014/2015 2015/2016 2016/2017 2017/2018 2018/2019 2019/2020 2020/2021 2021/<strong>2022</strong><br />
($000) ($000) ($000) ($000) ($000) ($000) ($000) ($000) ($000) ($000) ($000)<br />
Cash Flows from Operating Activities<br />
Cash provided from:<br />
Rates 12,723 13,630 14,473 15,311 15,862 16,536 17,126 17,646 18,428 19,193 19,912<br />
Hanmer Springs Thermal Reserve 9,632 9,572 10,004 10,305 10,923 11,257 11,591 12,283 12,656 13,044 13,840<br />
Other Income 6,634 6,230 6,503 6,723 8,319 7,413 6,995 7,407 7,527 7,739 7,968<br />
Dividends Received 33 72 74 77 79 82 84 86 89 92 95<br />
Money Received from Other Authorities 2,243 2,243 2,243 2,243 2,243 2,243 2,243 2,243 2,243 2,243 2,243<br />
31,265 31,747 33,297 34,658 37,426 37,530 38,040 39,666 40,943 42,312 44,057<br />
Cash paid to:<br />
Cost of Services 22,161 23,369 24,225 25,115 25,658 26,592 27,431 28,089 28,919 29,924 30,824<br />
Interest Paid 831 969 1,203 1,297 1,359 1,391 1,375 1,281 1,156 1,000 828<br />
Money paid to Other Authorities 2,243 2,243 2,243 2,243 2,243 2,243 2,243 2,243 2,243 2,243 2,243<br />
25,235 26,580 27,671 28,655 29,261 30,226 31,049 31,613 32,318 33,167 33,895<br />
Net Cash Flow from Operating Activities 6,030 5,167 5,626 6,003 8,166 7,304 6,991 8,053 8,625 9,145 10,162<br />
Cash Flows from Investing Activities<br />
Cash provided from:<br />
Sale of Fixed Assets 0 0 0 0 0 0 0 0 0 0 0<br />
Sale of Investments 0 0 0 0 0 0 0 0 0 0 0<br />
0 0 0 0 0 0 0 0 0 0 0<br />
Cash paid to:<br />
Purchase of Fixed Assets 6,218 10,545 7,147 7,622 8,622 7,661 6,306 5,872 6,732 6,293 7,384<br />
Purchase of Investments 0 0 0 0 0 0 0 0 0 0 0<br />
6,218 10,545 7,147 7,622 8,622 7,661 6,306 5,872 6,732 6,293 7,384<br />
Net Cash Flows from Investing Activities (6,218) (10,545) (7,147) (7,622) (8,622) (7,661) (6,306) (5,872) (6,732) (6,293) (7,384)<br />
Cash Flows from Financing Activities<br />
Cash provided from:<br />
Loans Raised 400 5,098 1,500 1,500 500 500 0 0 0 0 0<br />
400 5,098 1,500 1,500 500 500 0 0 0 0 0<br />
Cash paid to:<br />
Loan Repayments 0 0 0 0 0 0 1,000 2,000 2,000 3,000 2,500<br />
0 0 0 0 0 0 1,000 2,000 2,000 3,000 2,500<br />
Net Cash Flows from Financing Activities 400 5,098 1,500 1,500 500 500 (1,000) (2,000) (2,000) (3,000) (2,500)<br />
Net Increase/(Decrease) in Cash Held 212 (280) (22) (119) 44 143 (315) 181 (107) (149) 278<br />
Opening Cash Balance (31) 715 435 413 295 338 482 167 348 241 92<br />
Closing Cash Balance 181 435 413 295 338 482 167 348 241 92 370<br />
C:\Users\jab\Desktop\Fuck Up with Subsidised Roading\<strong>Hurunui</strong> <strong>District</strong> <strong>Council</strong> LTP Budgets <strong>2012</strong>-<strong>2022</strong> - Post Submissions - with Option 2 for Subsidised Roading.xls 27/06/<strong>2012</strong> 2:26 p.m.<br />
164